Economic Analysis
Analysis Date: September 17, 2025
Key Research Questions
- How do economic indicators (GDP per capita, unemployment) relate to citizen well-being?
- What are the regional patterns in economic development?
- Which countries represent economic outliers and what can we learn from them?
- How can countries be clustered based on their economic profiles?
Executive Summary
Economic Overview
This section examines the distribution of economic indicators across all countries and their relationships with well-being outcomes.
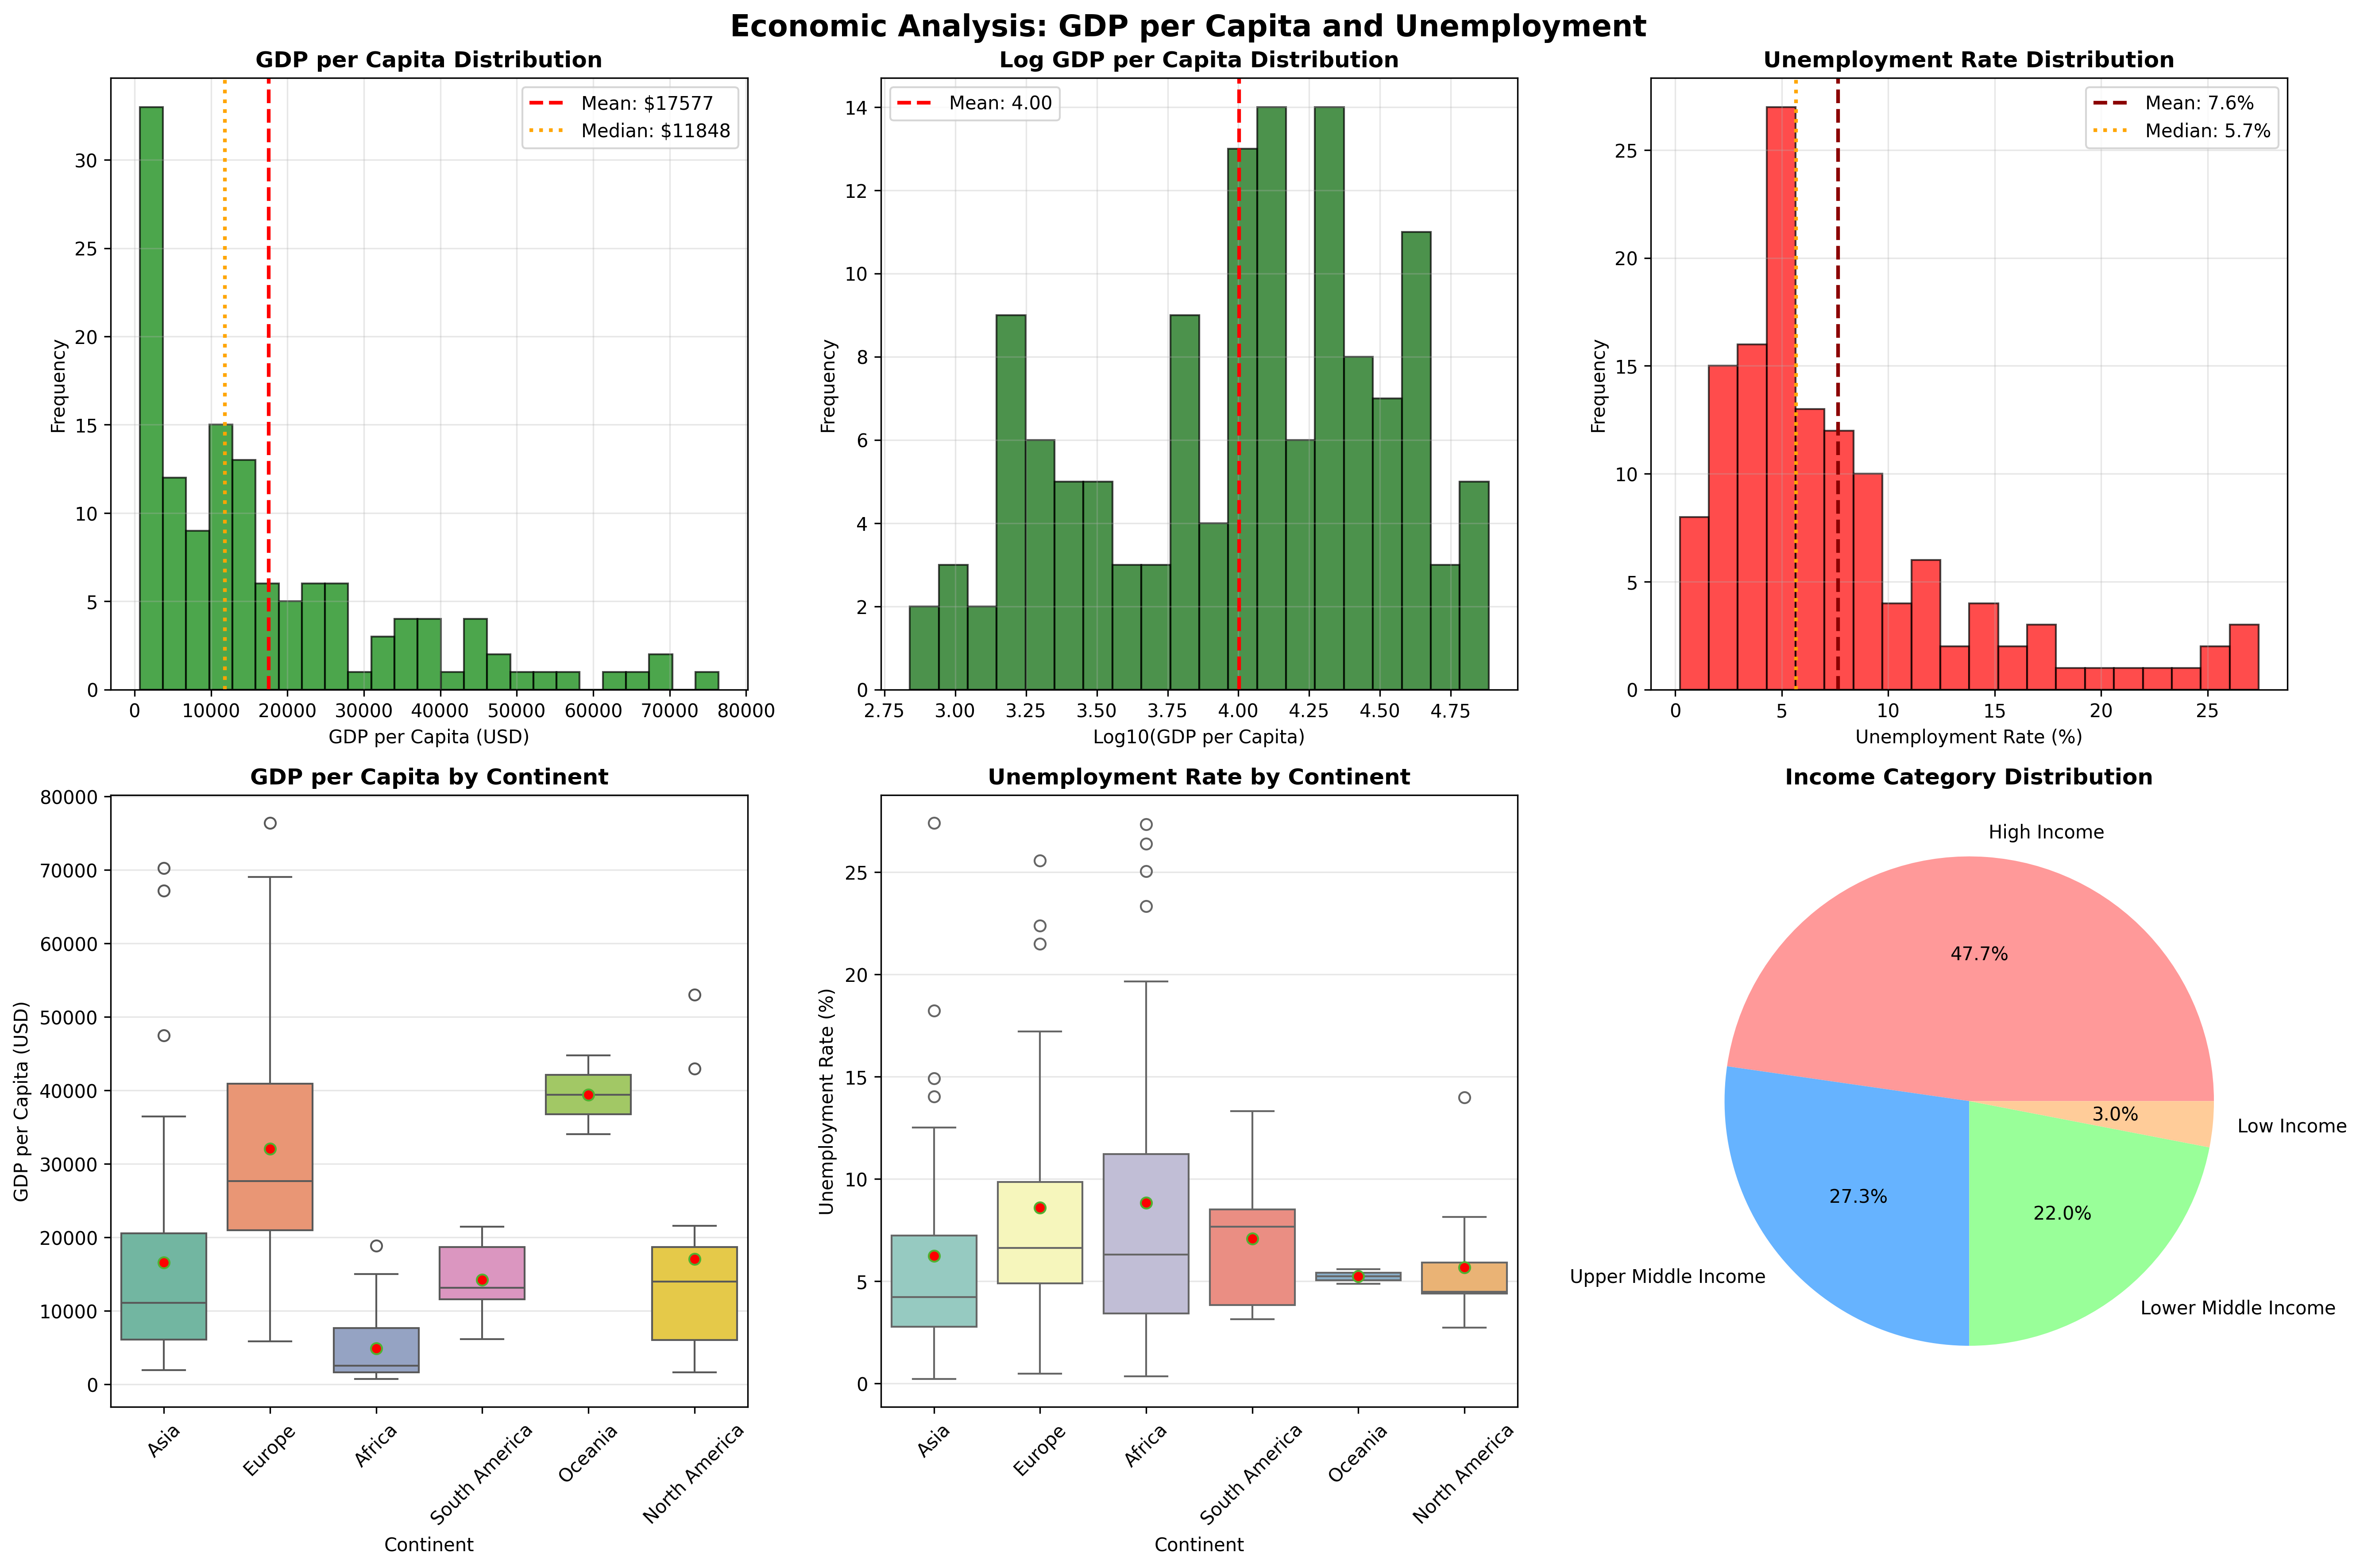
Income Classification
| Income Category | Countries | Percentage | GDP Range |
|---|---|---|---|
| High Income | 63 | 47.7% | $12,696+ |
| Upper Middle Income | 36 | 27.3% | $4,096 - $12,695 |
| Lower Middle Income | 29 | 22.0% | $1,046 - $4,095 |
| Low Income | 4 | 3.0% | < $1,045 |
Economic Correlations with Well-being
Analysis of how economic indicators correlate with various measures of citizen well-being and development.
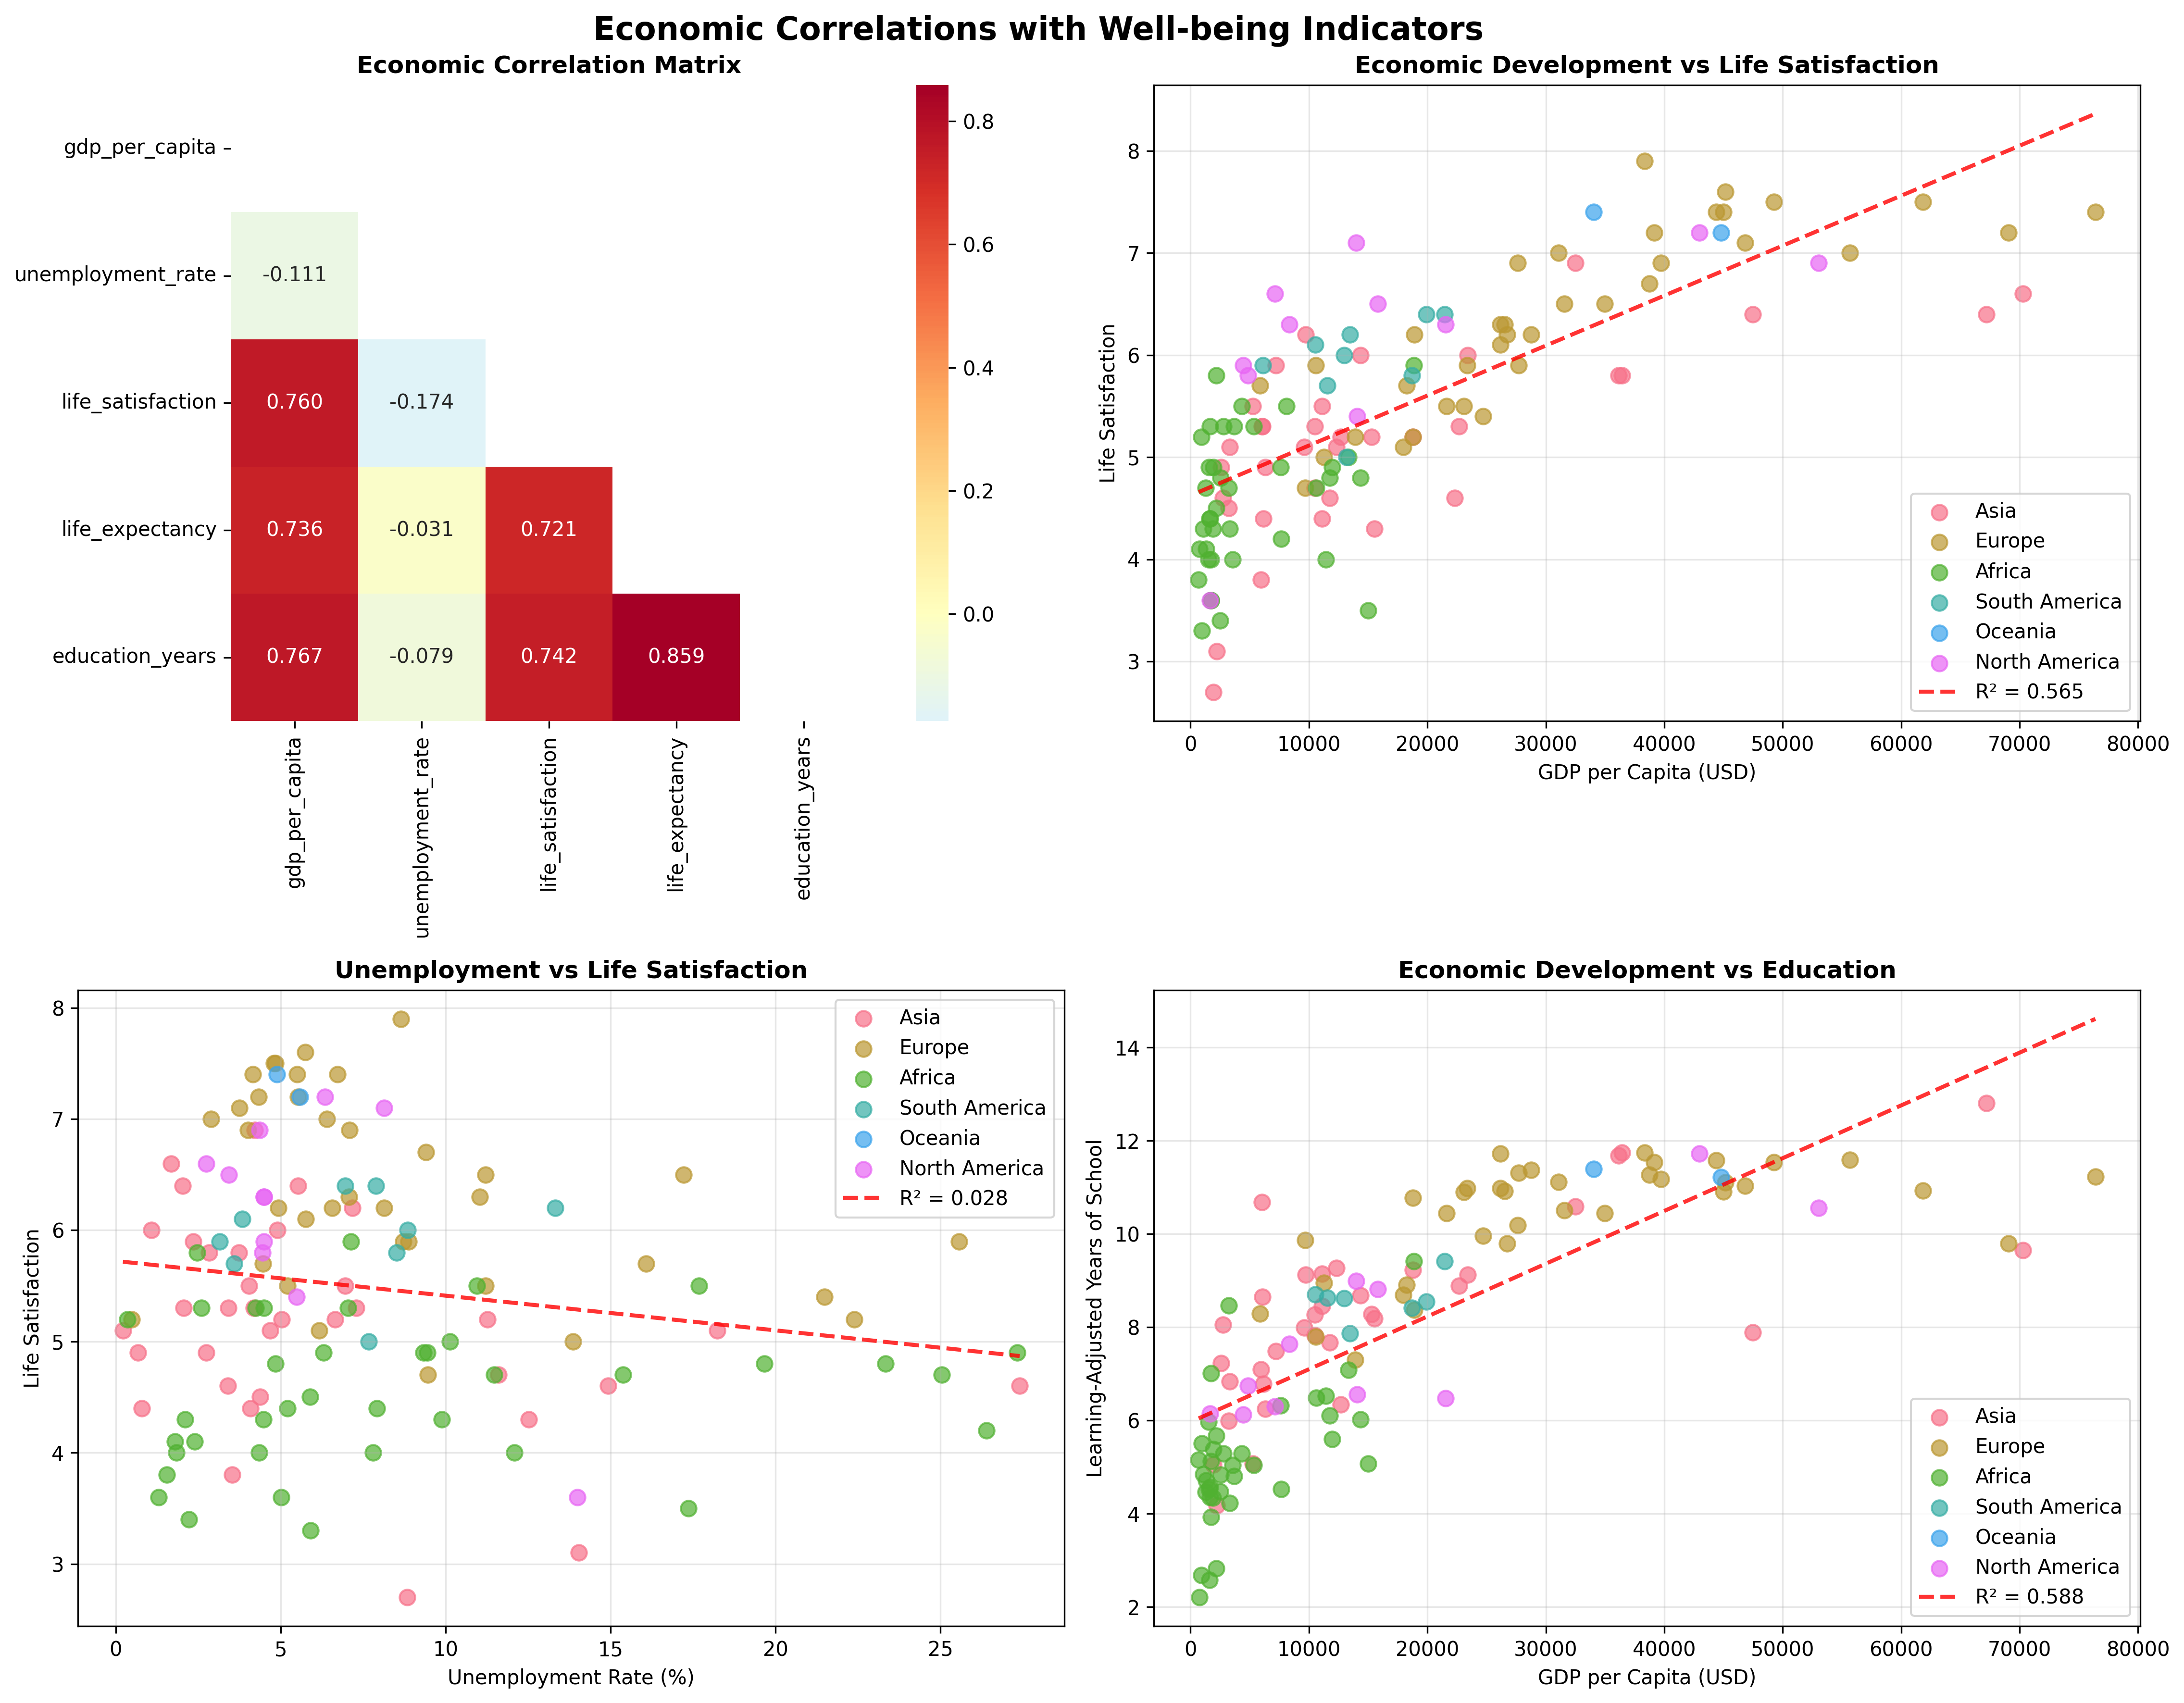
Key Economic Relationships
| Relationship | Correlation (r) | R² | Strength | Interpretation |
|---|---|---|---|---|
| GDP per Capita ↔ Life Satisfaction | 0.760 | 0.578 | Strong | Higher GDP strongly predicts life satisfaction |
| GDP per Capita ↔ Education Years | 0.767 | 0.588 | Strong | Economic development drives educational attainment |
| GDP per Capita ↔ Life Expectancy | 0.736 | 0.542 | Strong | Wealth enables better health outcomes |
| Unemployment ↔ Life Satisfaction | -0.174 | 0.030 | Weak | Modest negative impact of unemployment |
Economic Clustering Analysis
Countries grouped into 4 distinct economic clusters based on GDP per capita, unemployment rates, and well-being indicators.
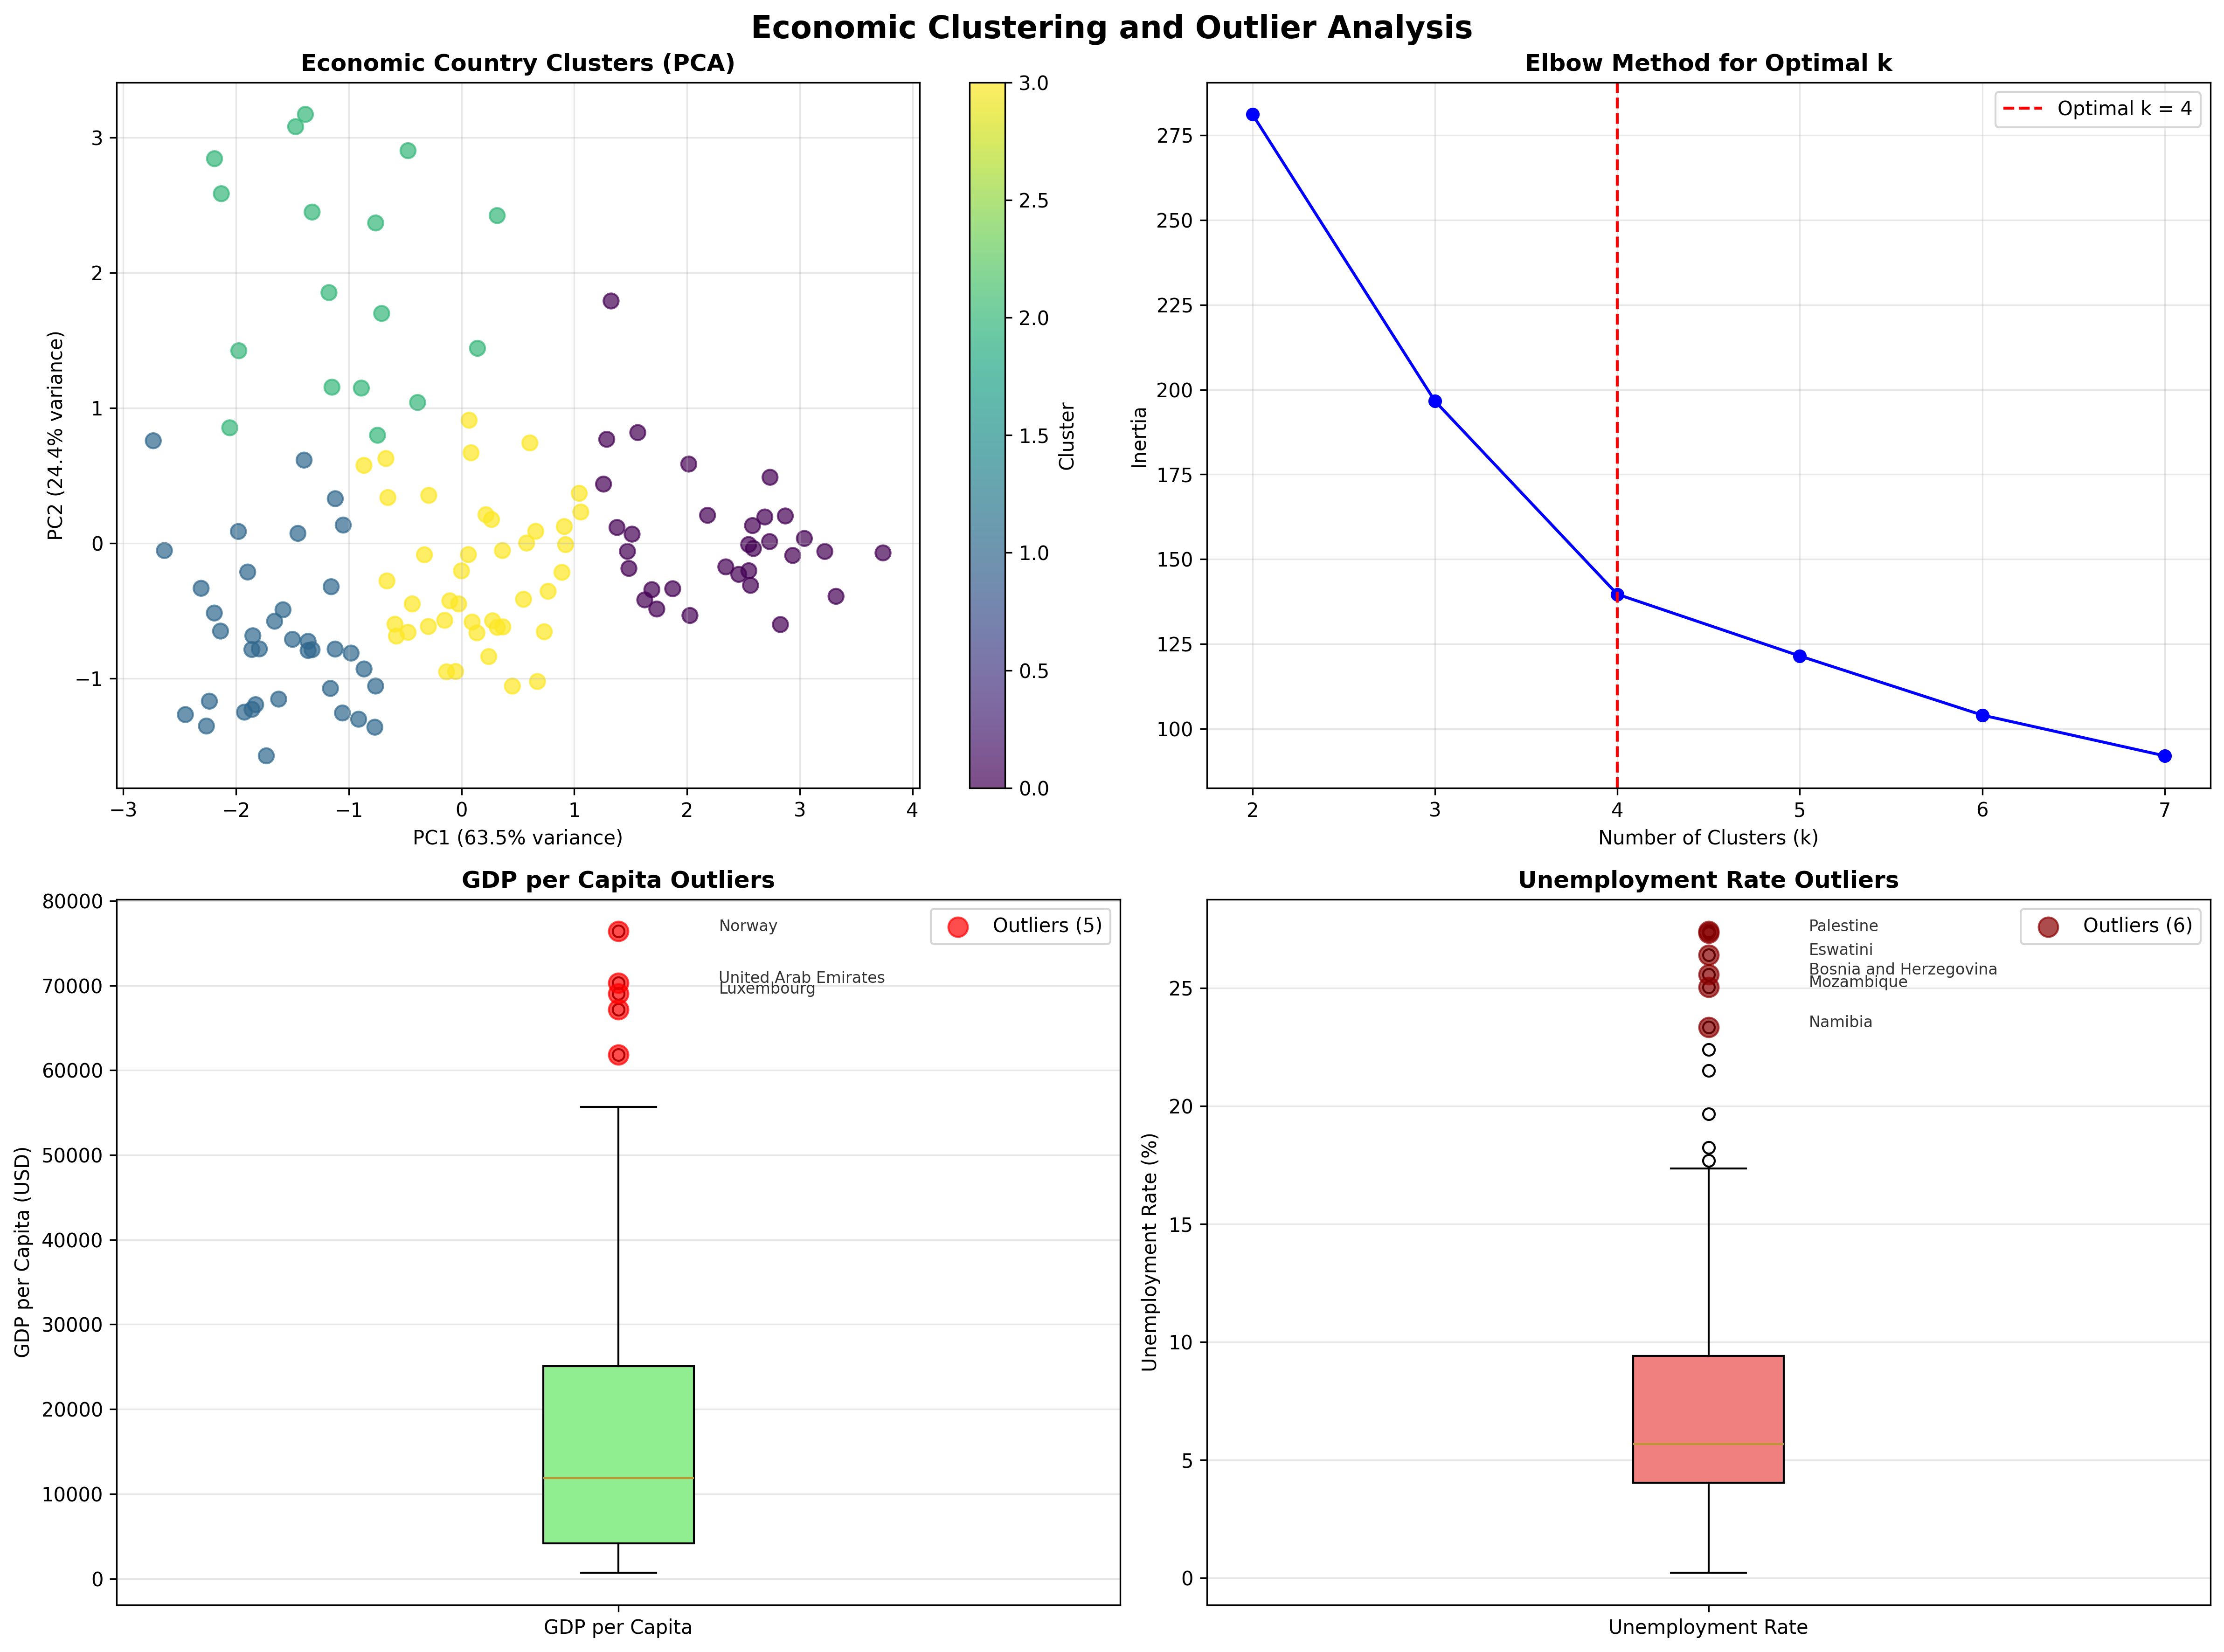
Economic Outliers
Countries with exceptional economic indicators that warrant special attention.
GDP per Capita - Top Performers
Key Insight: These countries represent different development models - resource-rich nations, financial centers, and innovation economies.
Unemployment Rate - Areas of Concern
Key Insight: These countries face significant employment challenges that may impact citizen well-being and social stability.
Regional Economic Analysis
GDP per Capita by Region
ANOVA Result: Significant differences between continents (p < 0.001)
Interpretation: Economic development varies significantly across global regions, reflecting historical, geographical, and policy differences.