Enhanced Health and Well-being Analysis
Analysis Date: September 17, 2025
Key Research Questions
- To what extent are global citizens thriving in terms of health and well-being?
- How do health outcomes, life satisfaction, and mortality patterns compare across countries and regions?
- What are the key relationships between different health indicators?
- Which countries represent outliers in terms of health outcomes?
Executive Summary
Health Indicator Distributions
The distribution analysis examines the shape, central tendency, and spread of each health indicator across all countries.
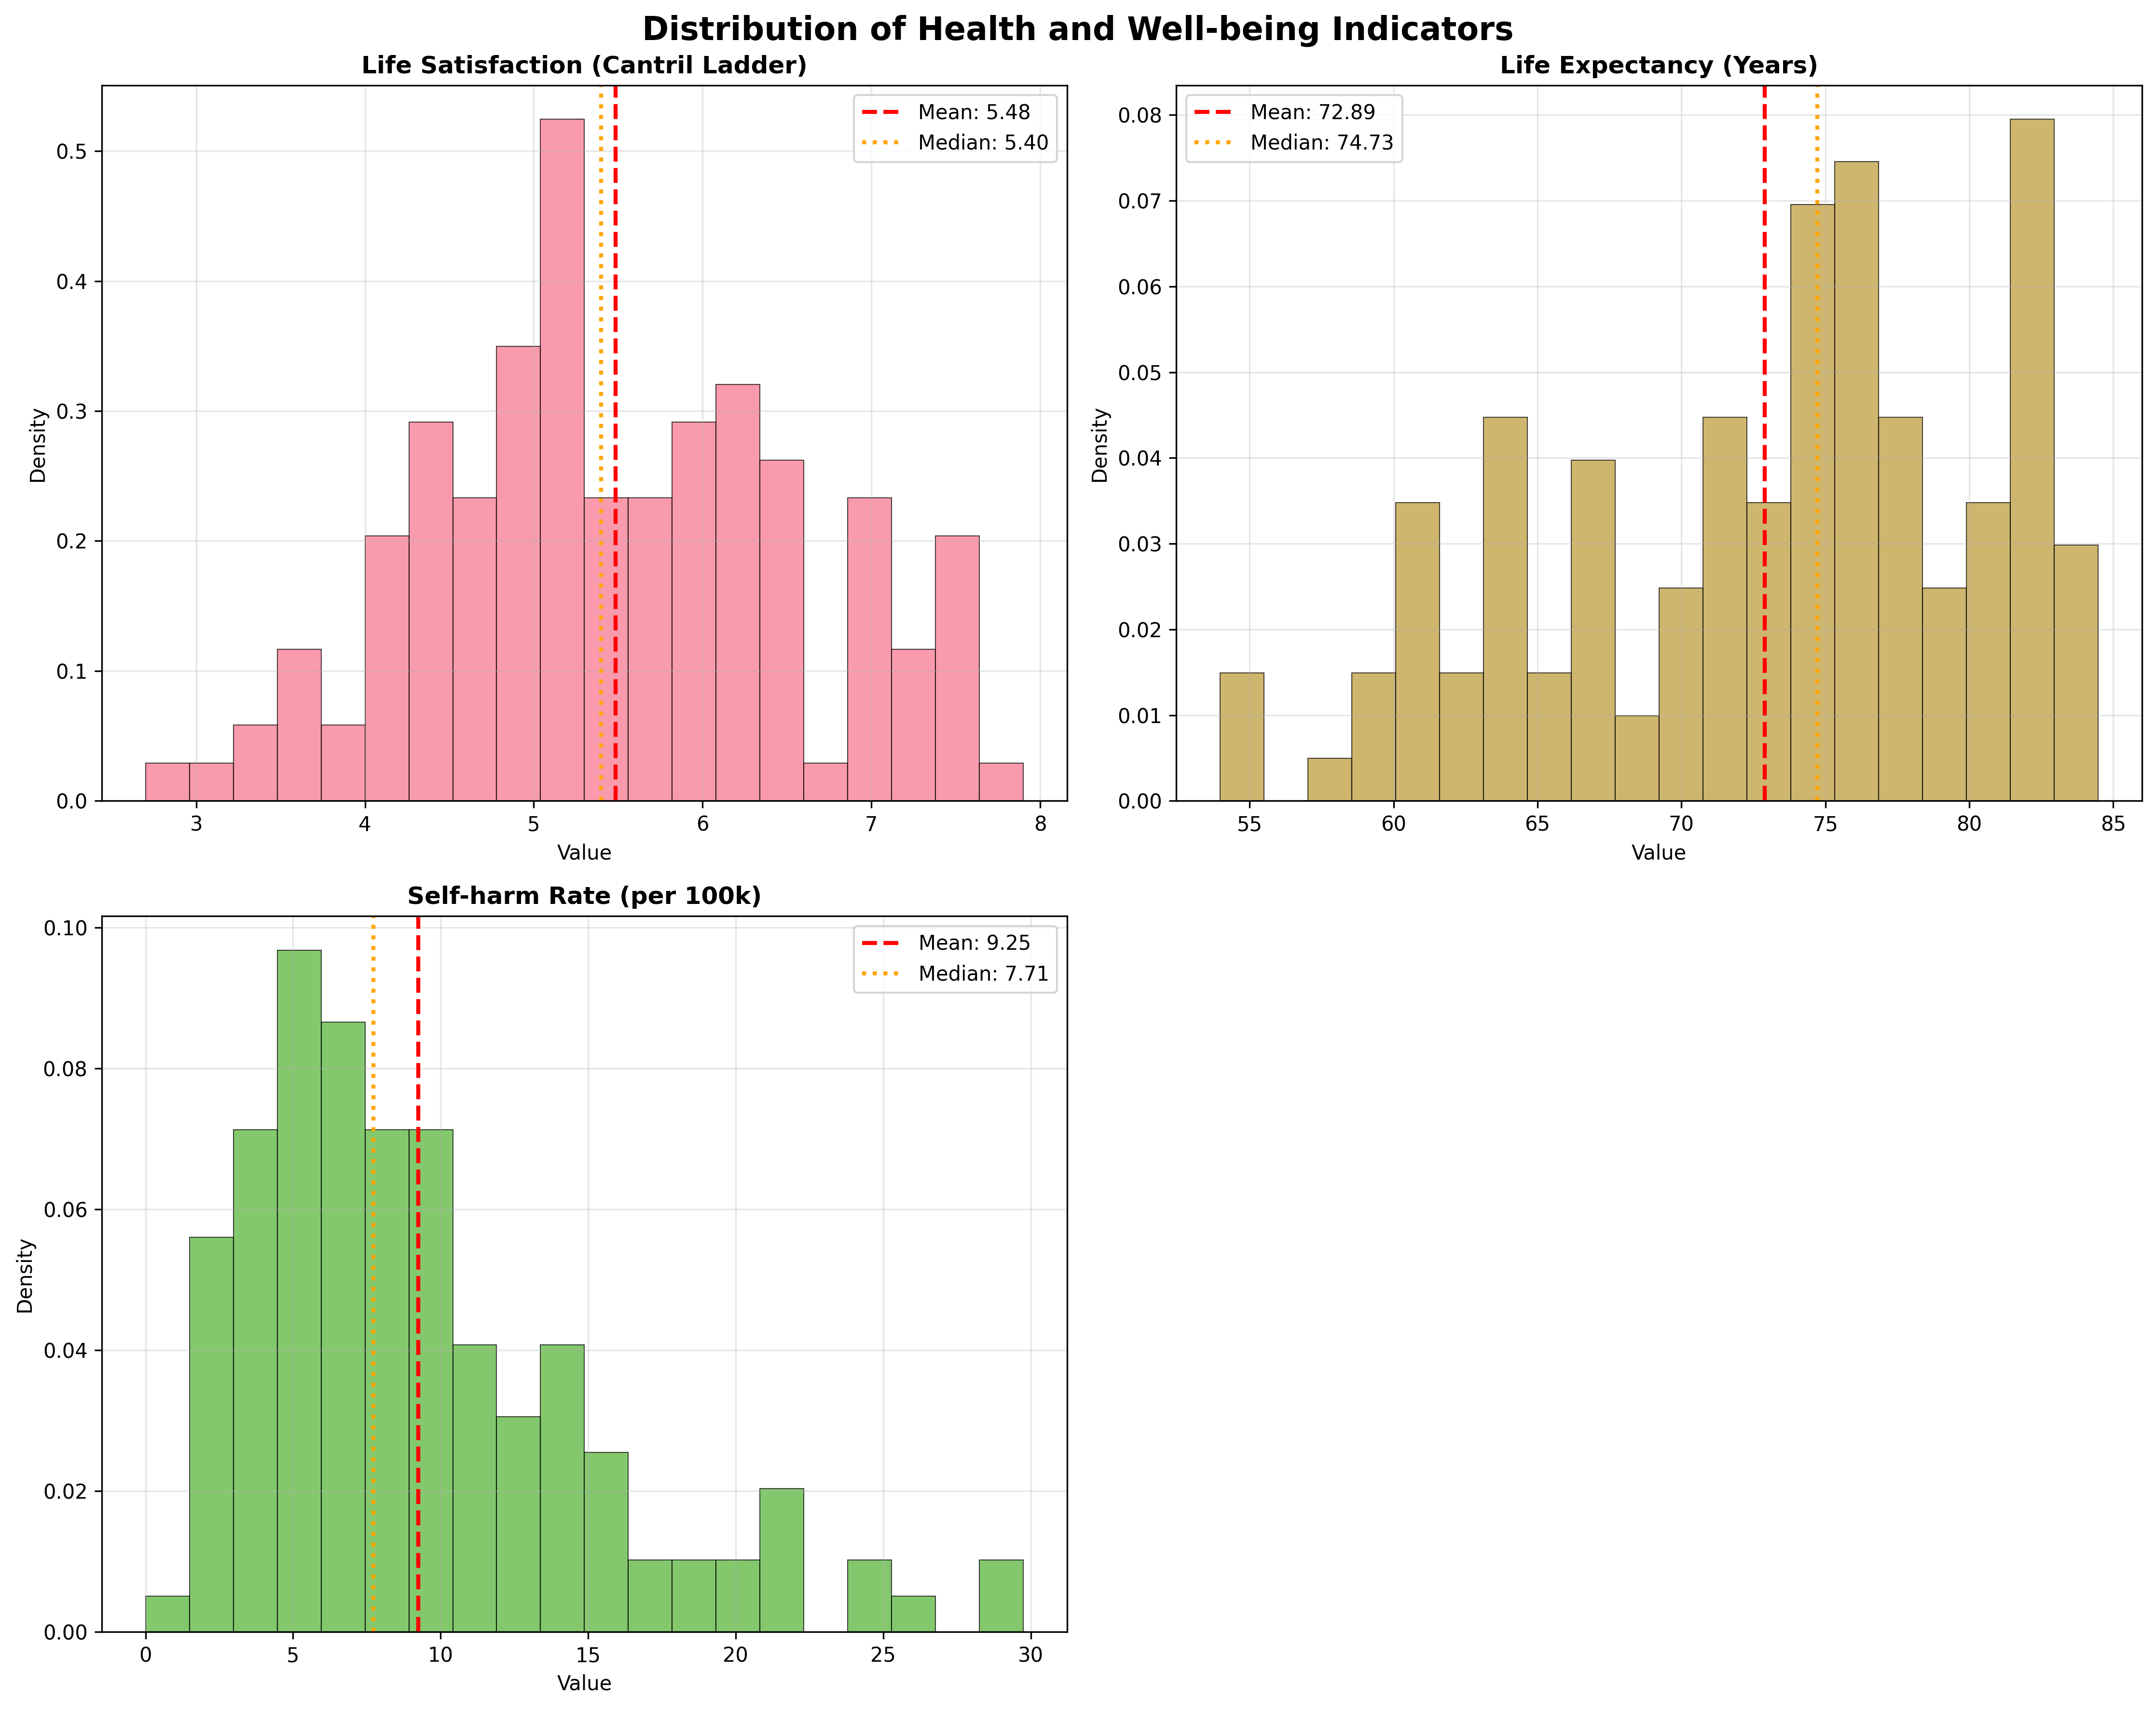
Statistical Summary
| Indicator | Count | Mean | Std Dev | Skewness | Normal Distribution? |
|---|---|---|---|---|---|
| Life Satisfaction | 132 | 5.485 | 1.112 | -0.014 | Yes |
| Life Expectancy | 132 | 72.889 | 7.624 | -0.522 | No |
| Self Harm Rate | 132 | 9.249 | 5.927 | 1.240 | No |
Regional Analysis
Regional analysis compares health indicators across continents using ANOVA tests to identify significant differences.
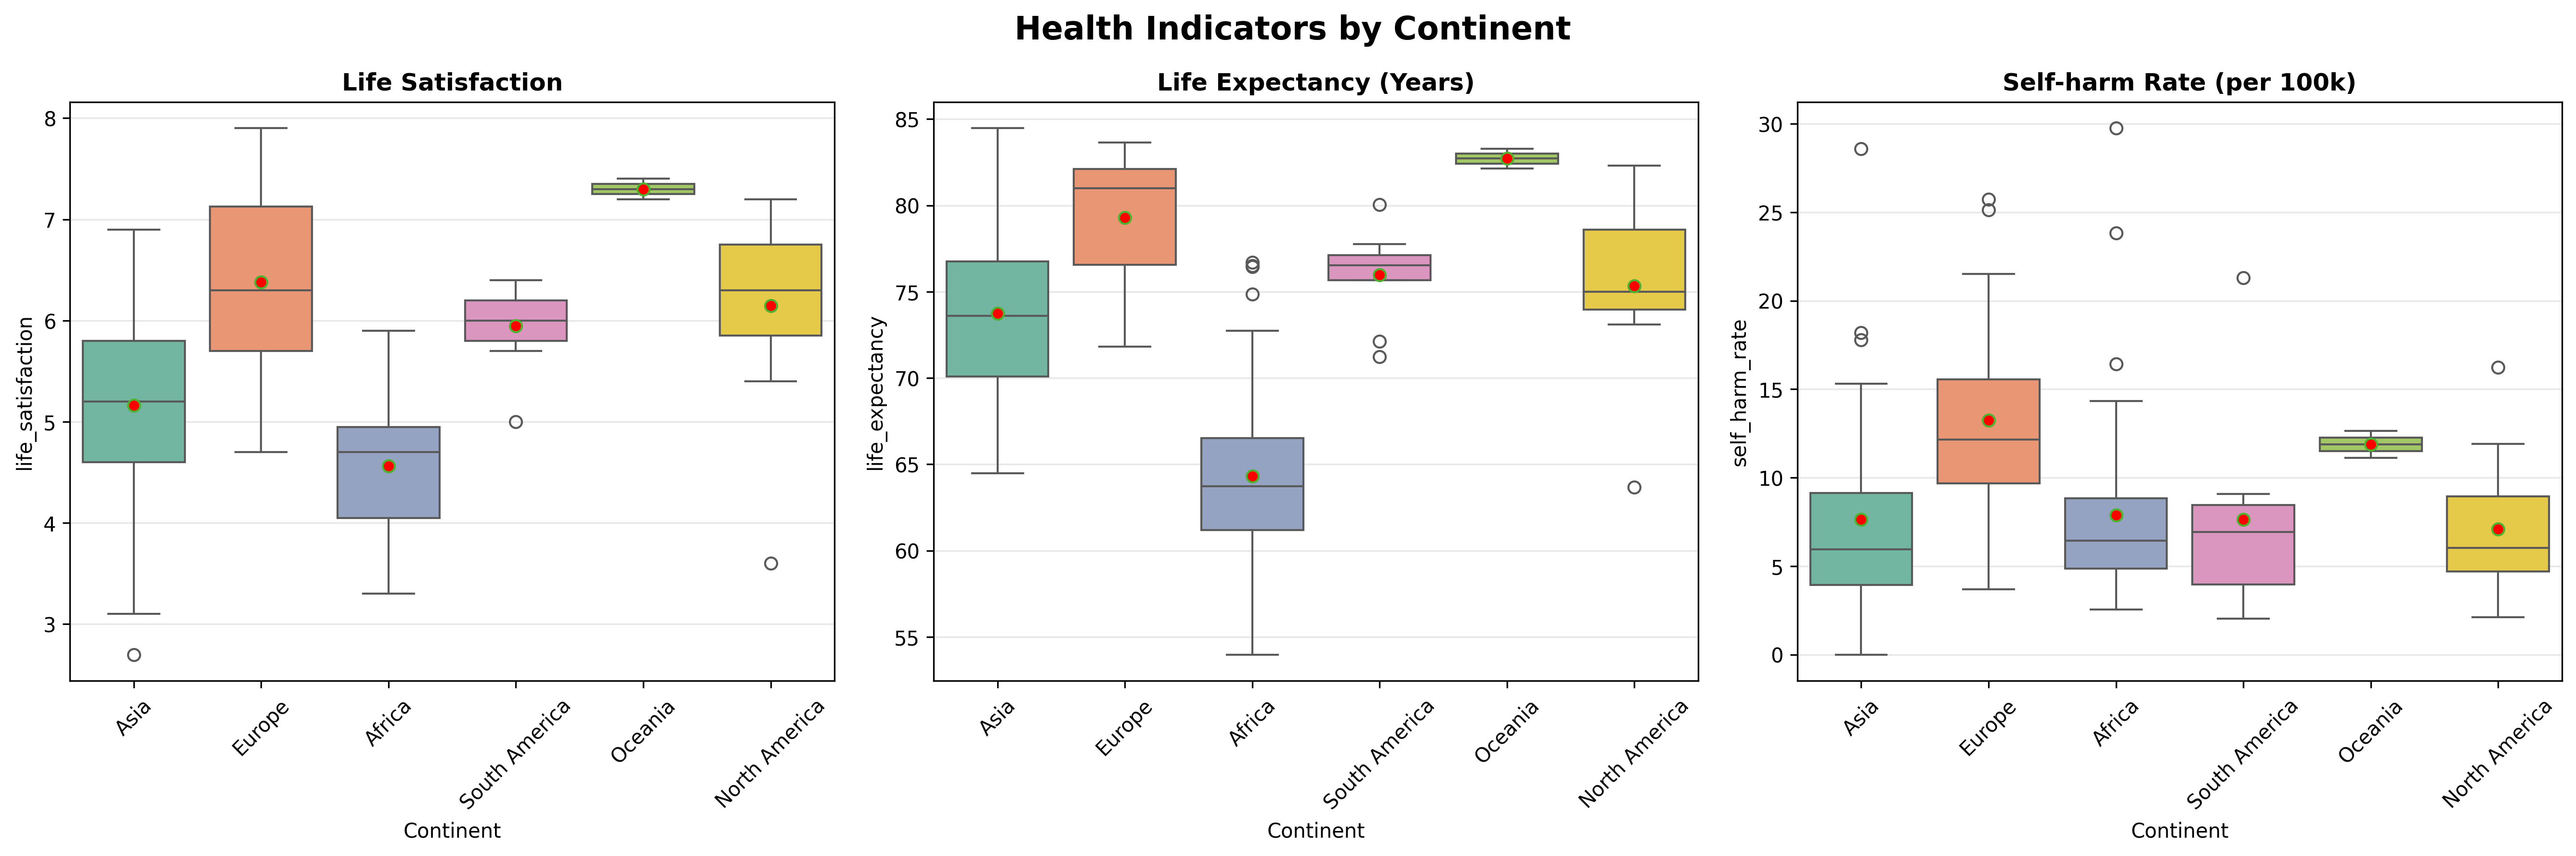
ANOVA Results
Life Satisfaction
ANOVA Result: Significant (p = 0.0000)
Interpretation: There are significant differences between continents.
Life Expectancy
ANOVA Result: Significant (p = 0.0000)
Interpretation: There are significant differences between continents.
Self Harm Rate
ANOVA Result: Significant (p = 0.0001)
Interpretation: There are significant differences between continents.
Correlation Analysis
Correlation analysis examines the relationships between different health indicators.
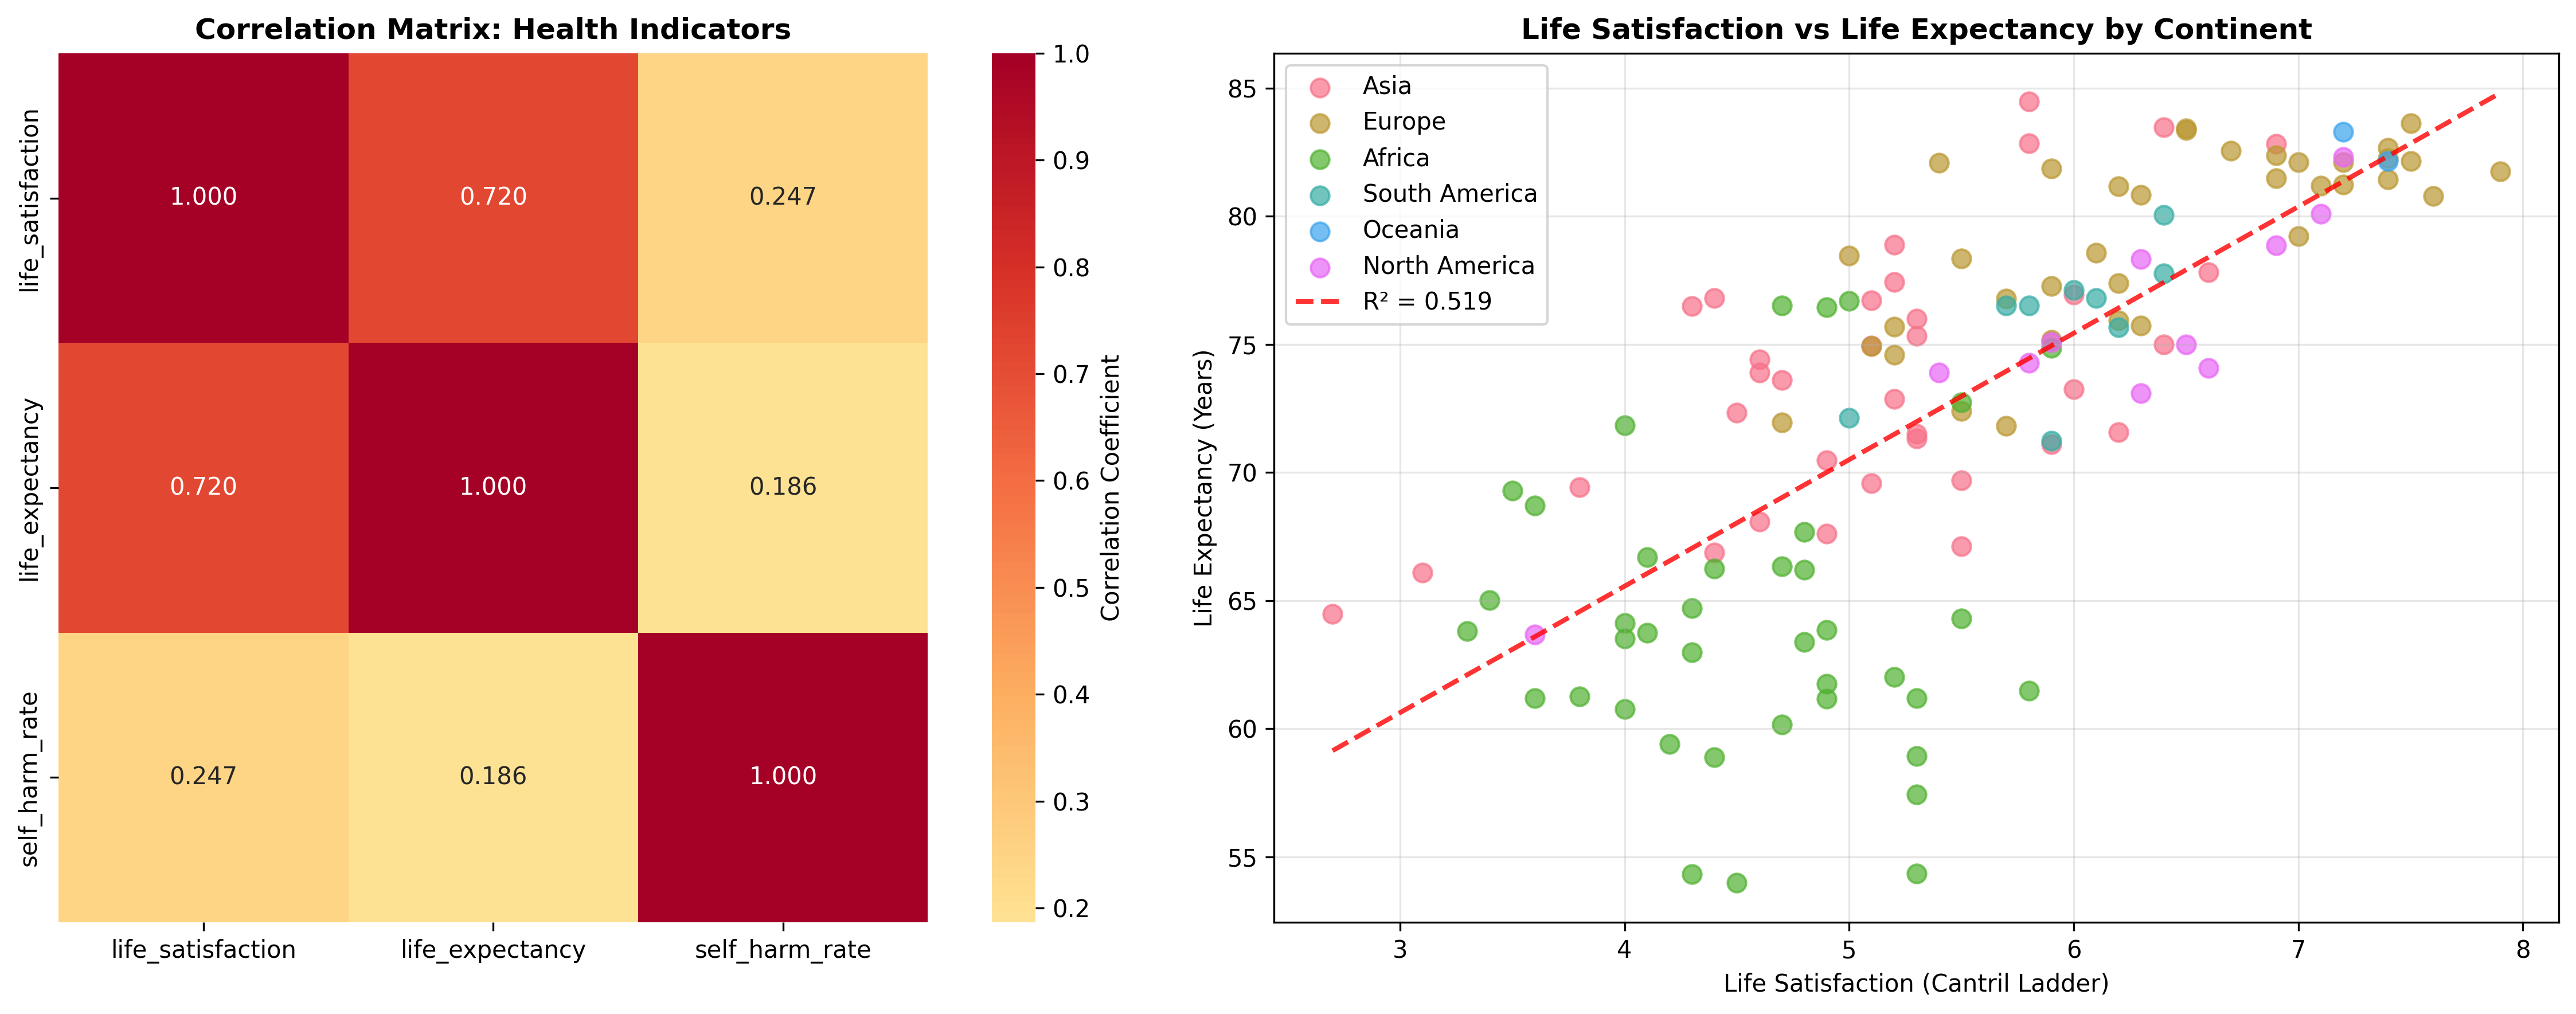
Correlation Results
| Relationship | Correlation (r) | R² | P-value | Significance | Strength |
|---|---|---|---|---|---|
| Life Satisfaction Vs Life Expectancy | 0.720 | 0.519 | 0.0000 | Significant | Strong |
| Life Satisfaction Vs Self Harm Rate | 0.247 | 0.061 | 0.0043 | Significant | Weak |
| Life Expectancy Vs Self Harm Rate | 0.186 | 0.035 | 0.0323 | Significant | Weak |
Outlier Analysis
Outlier analysis identifies countries with unusual health indicator values using Z-score methodology.
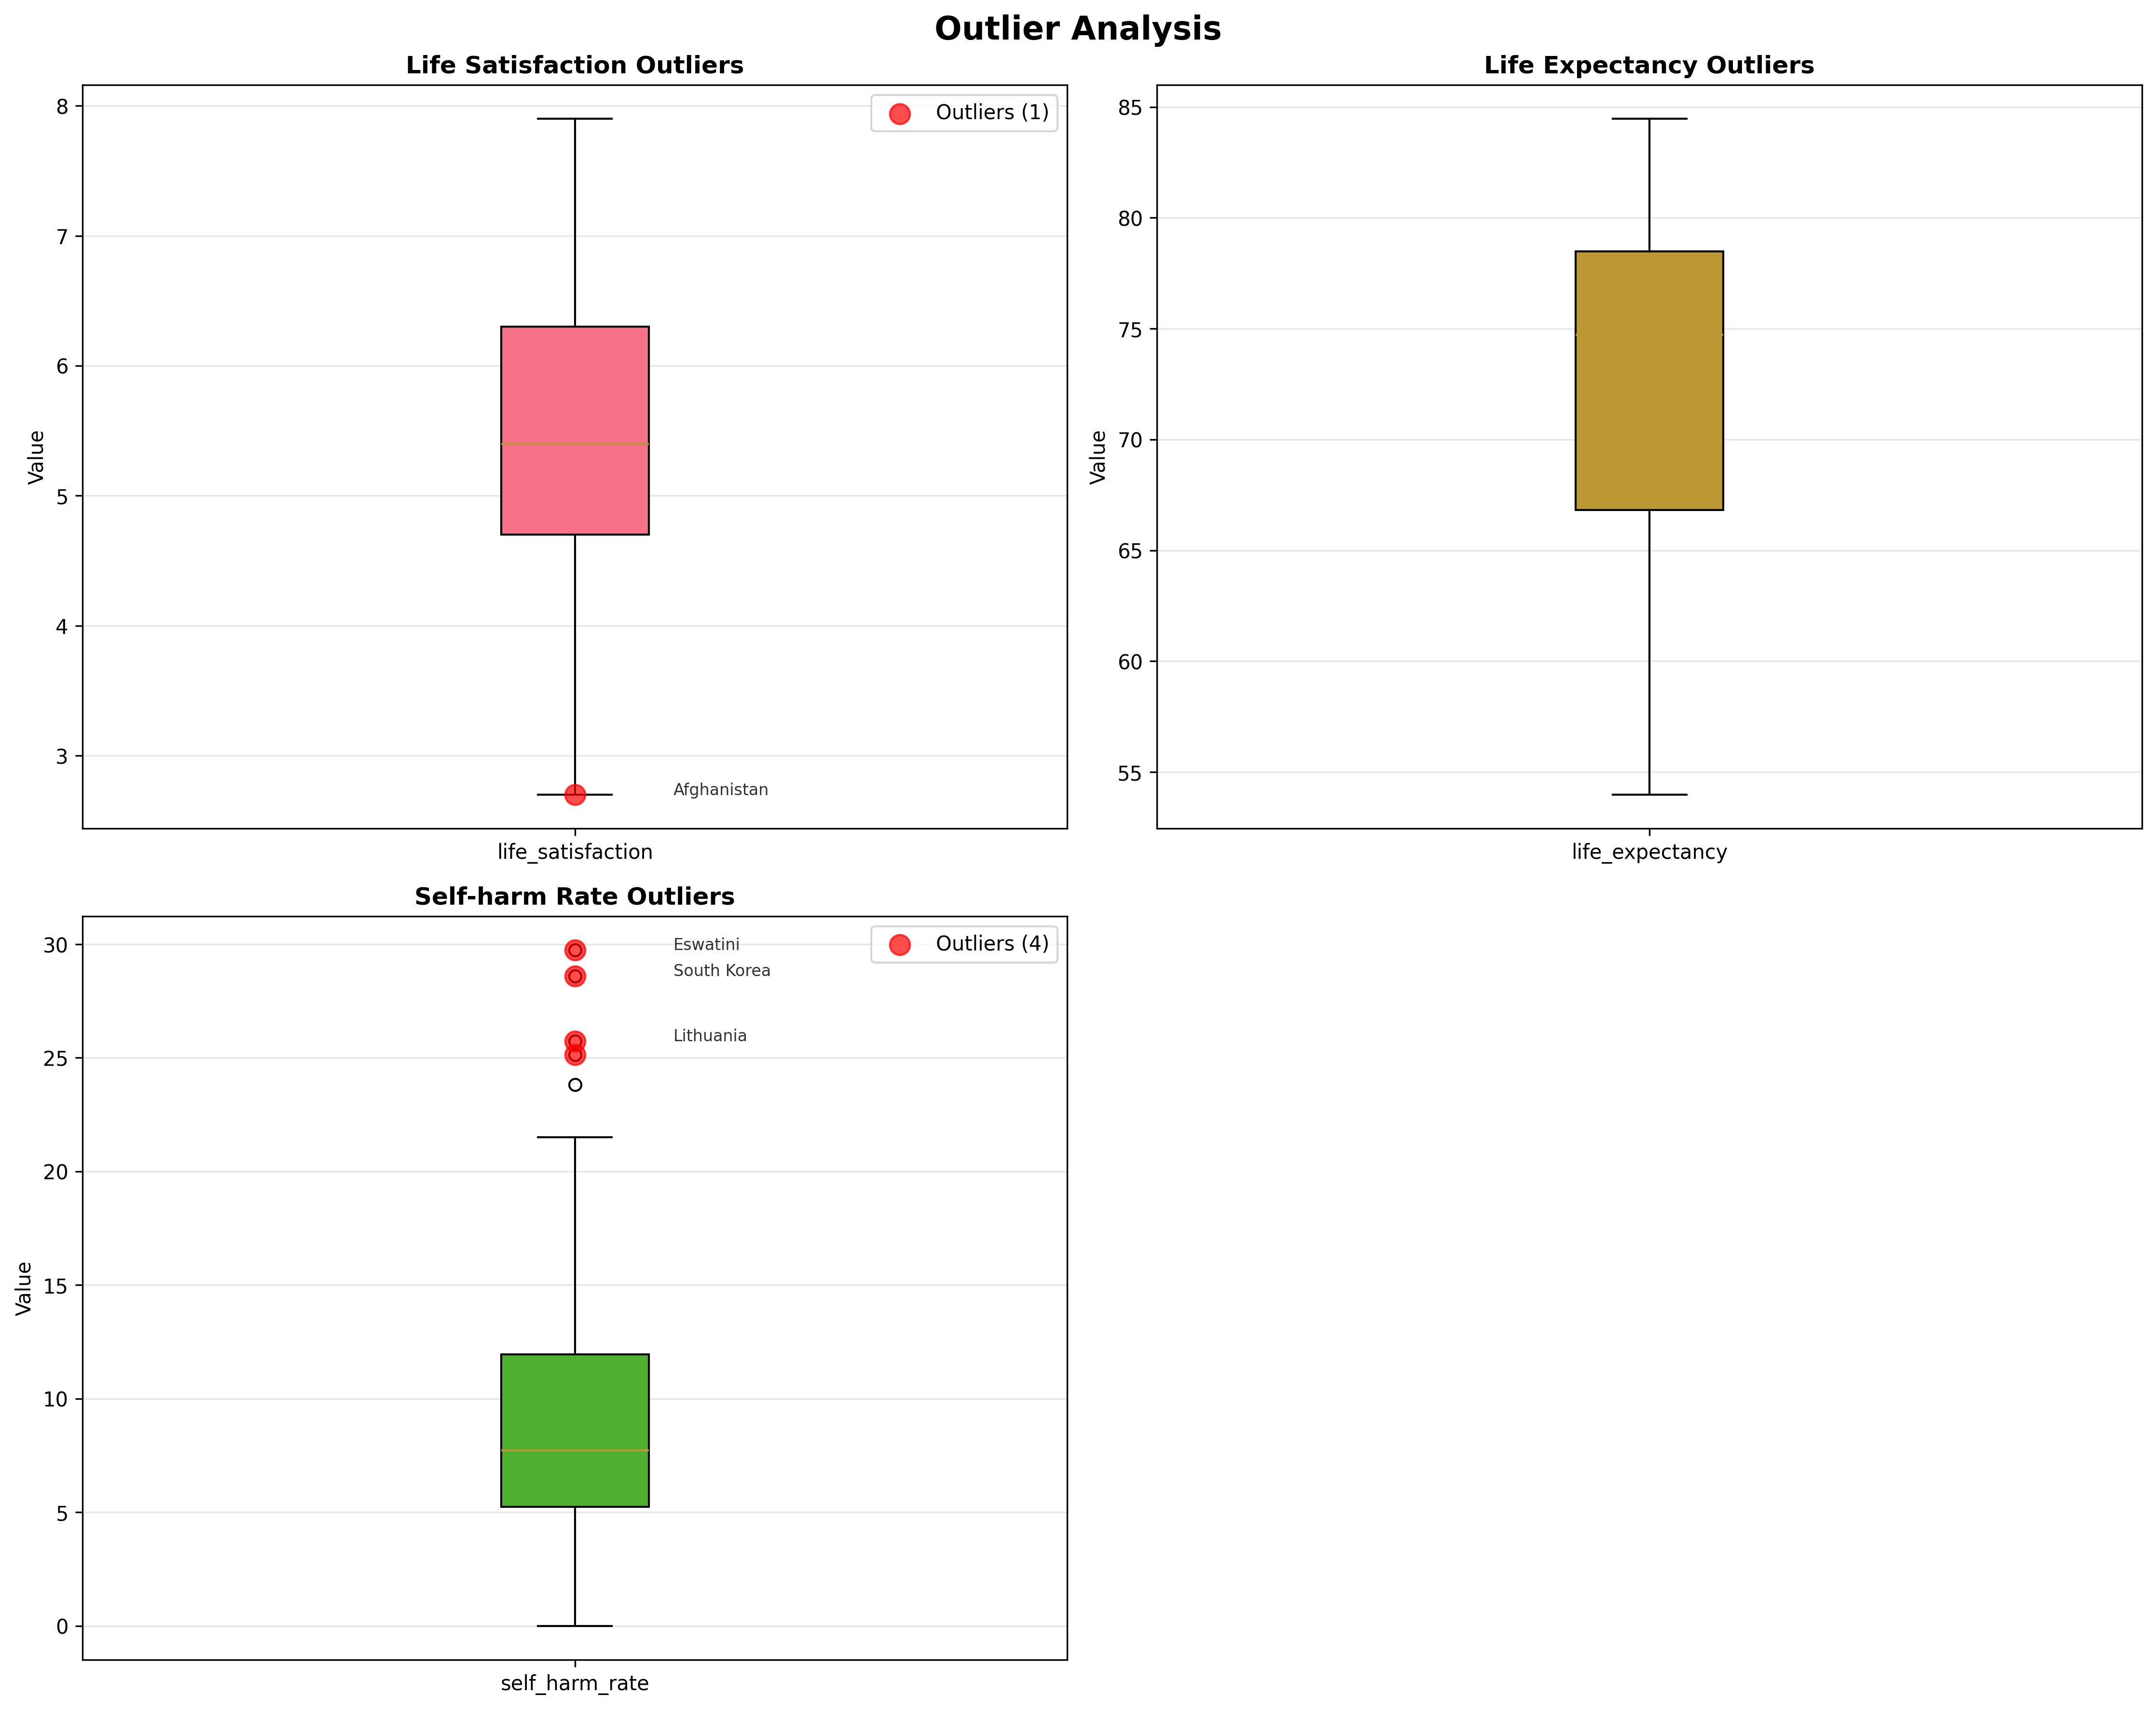
Identified Outlier Countries
Life Satisfaction
Life Expectancy
Self Harm Rate
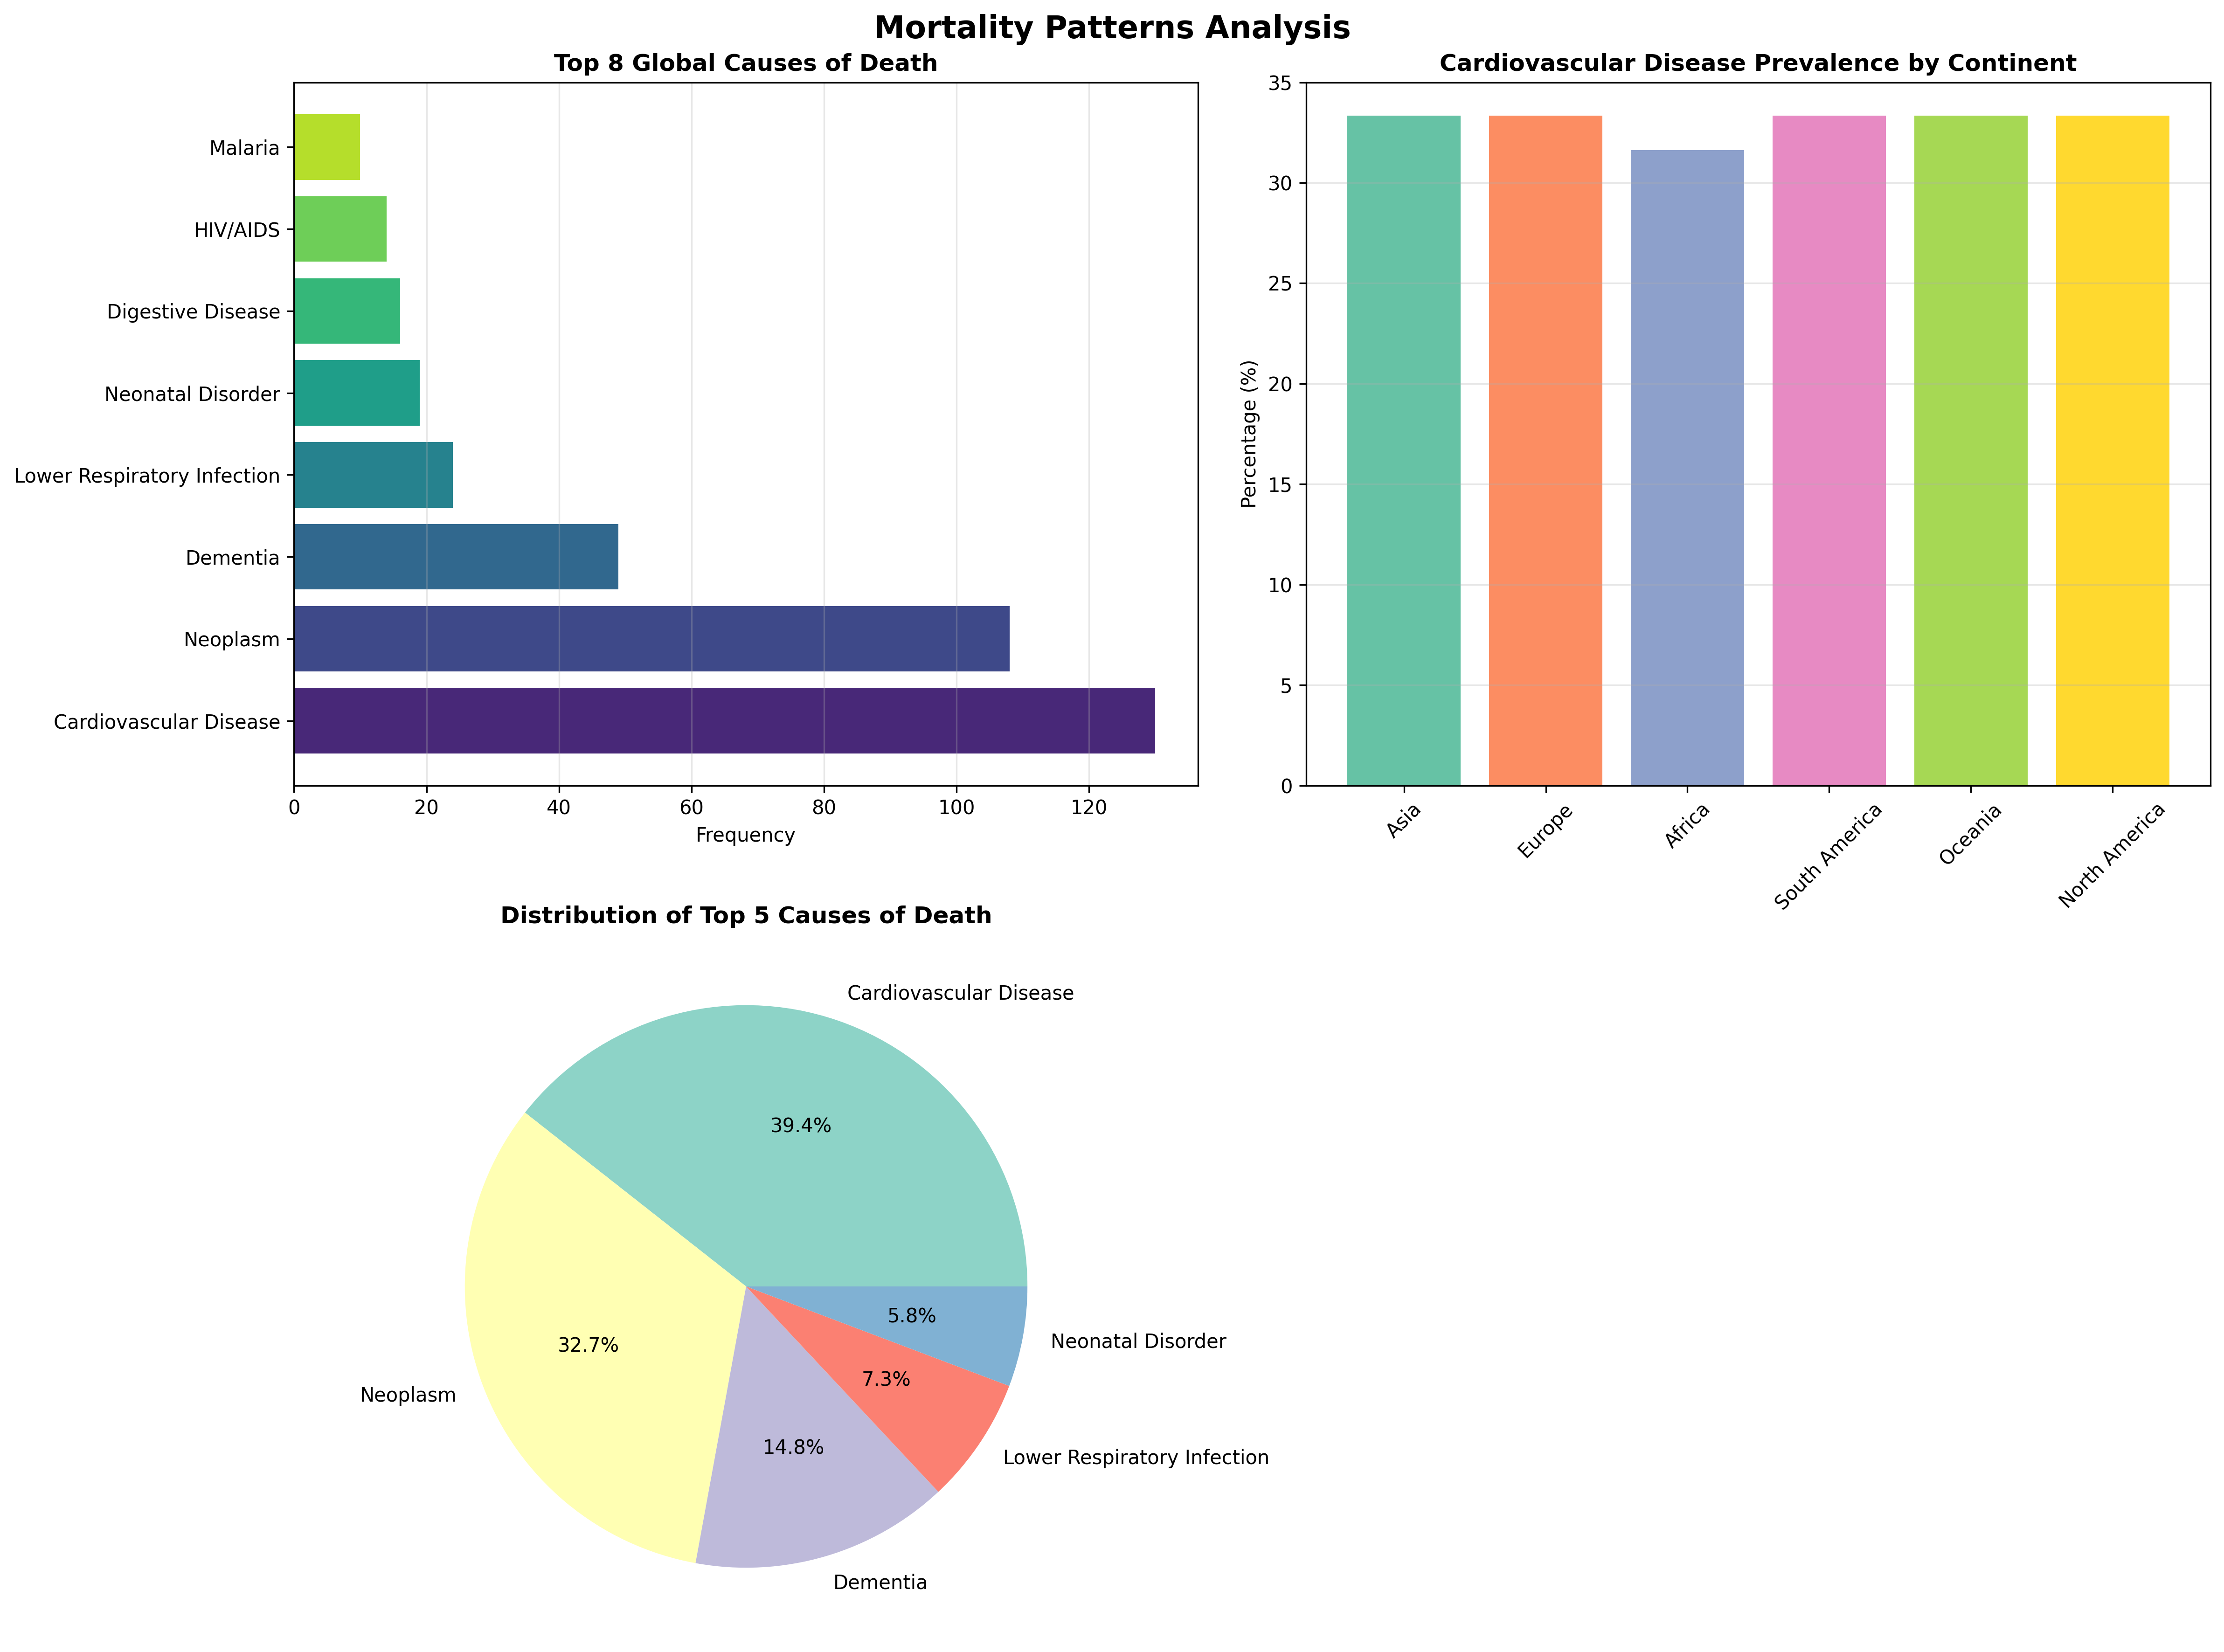
Mortality Patterns
Mortality analysis examines the leading causes of death globally and by continent.