🏗️ Infrastructure Analysis - Global Thriving Study
📊 Infrastructure Overview
132
Countries Analyzed
85.5%
Average Electricity Access
100.0%
Median Electricity Access
81
Universal Access Countries
🔍 Overview Insights
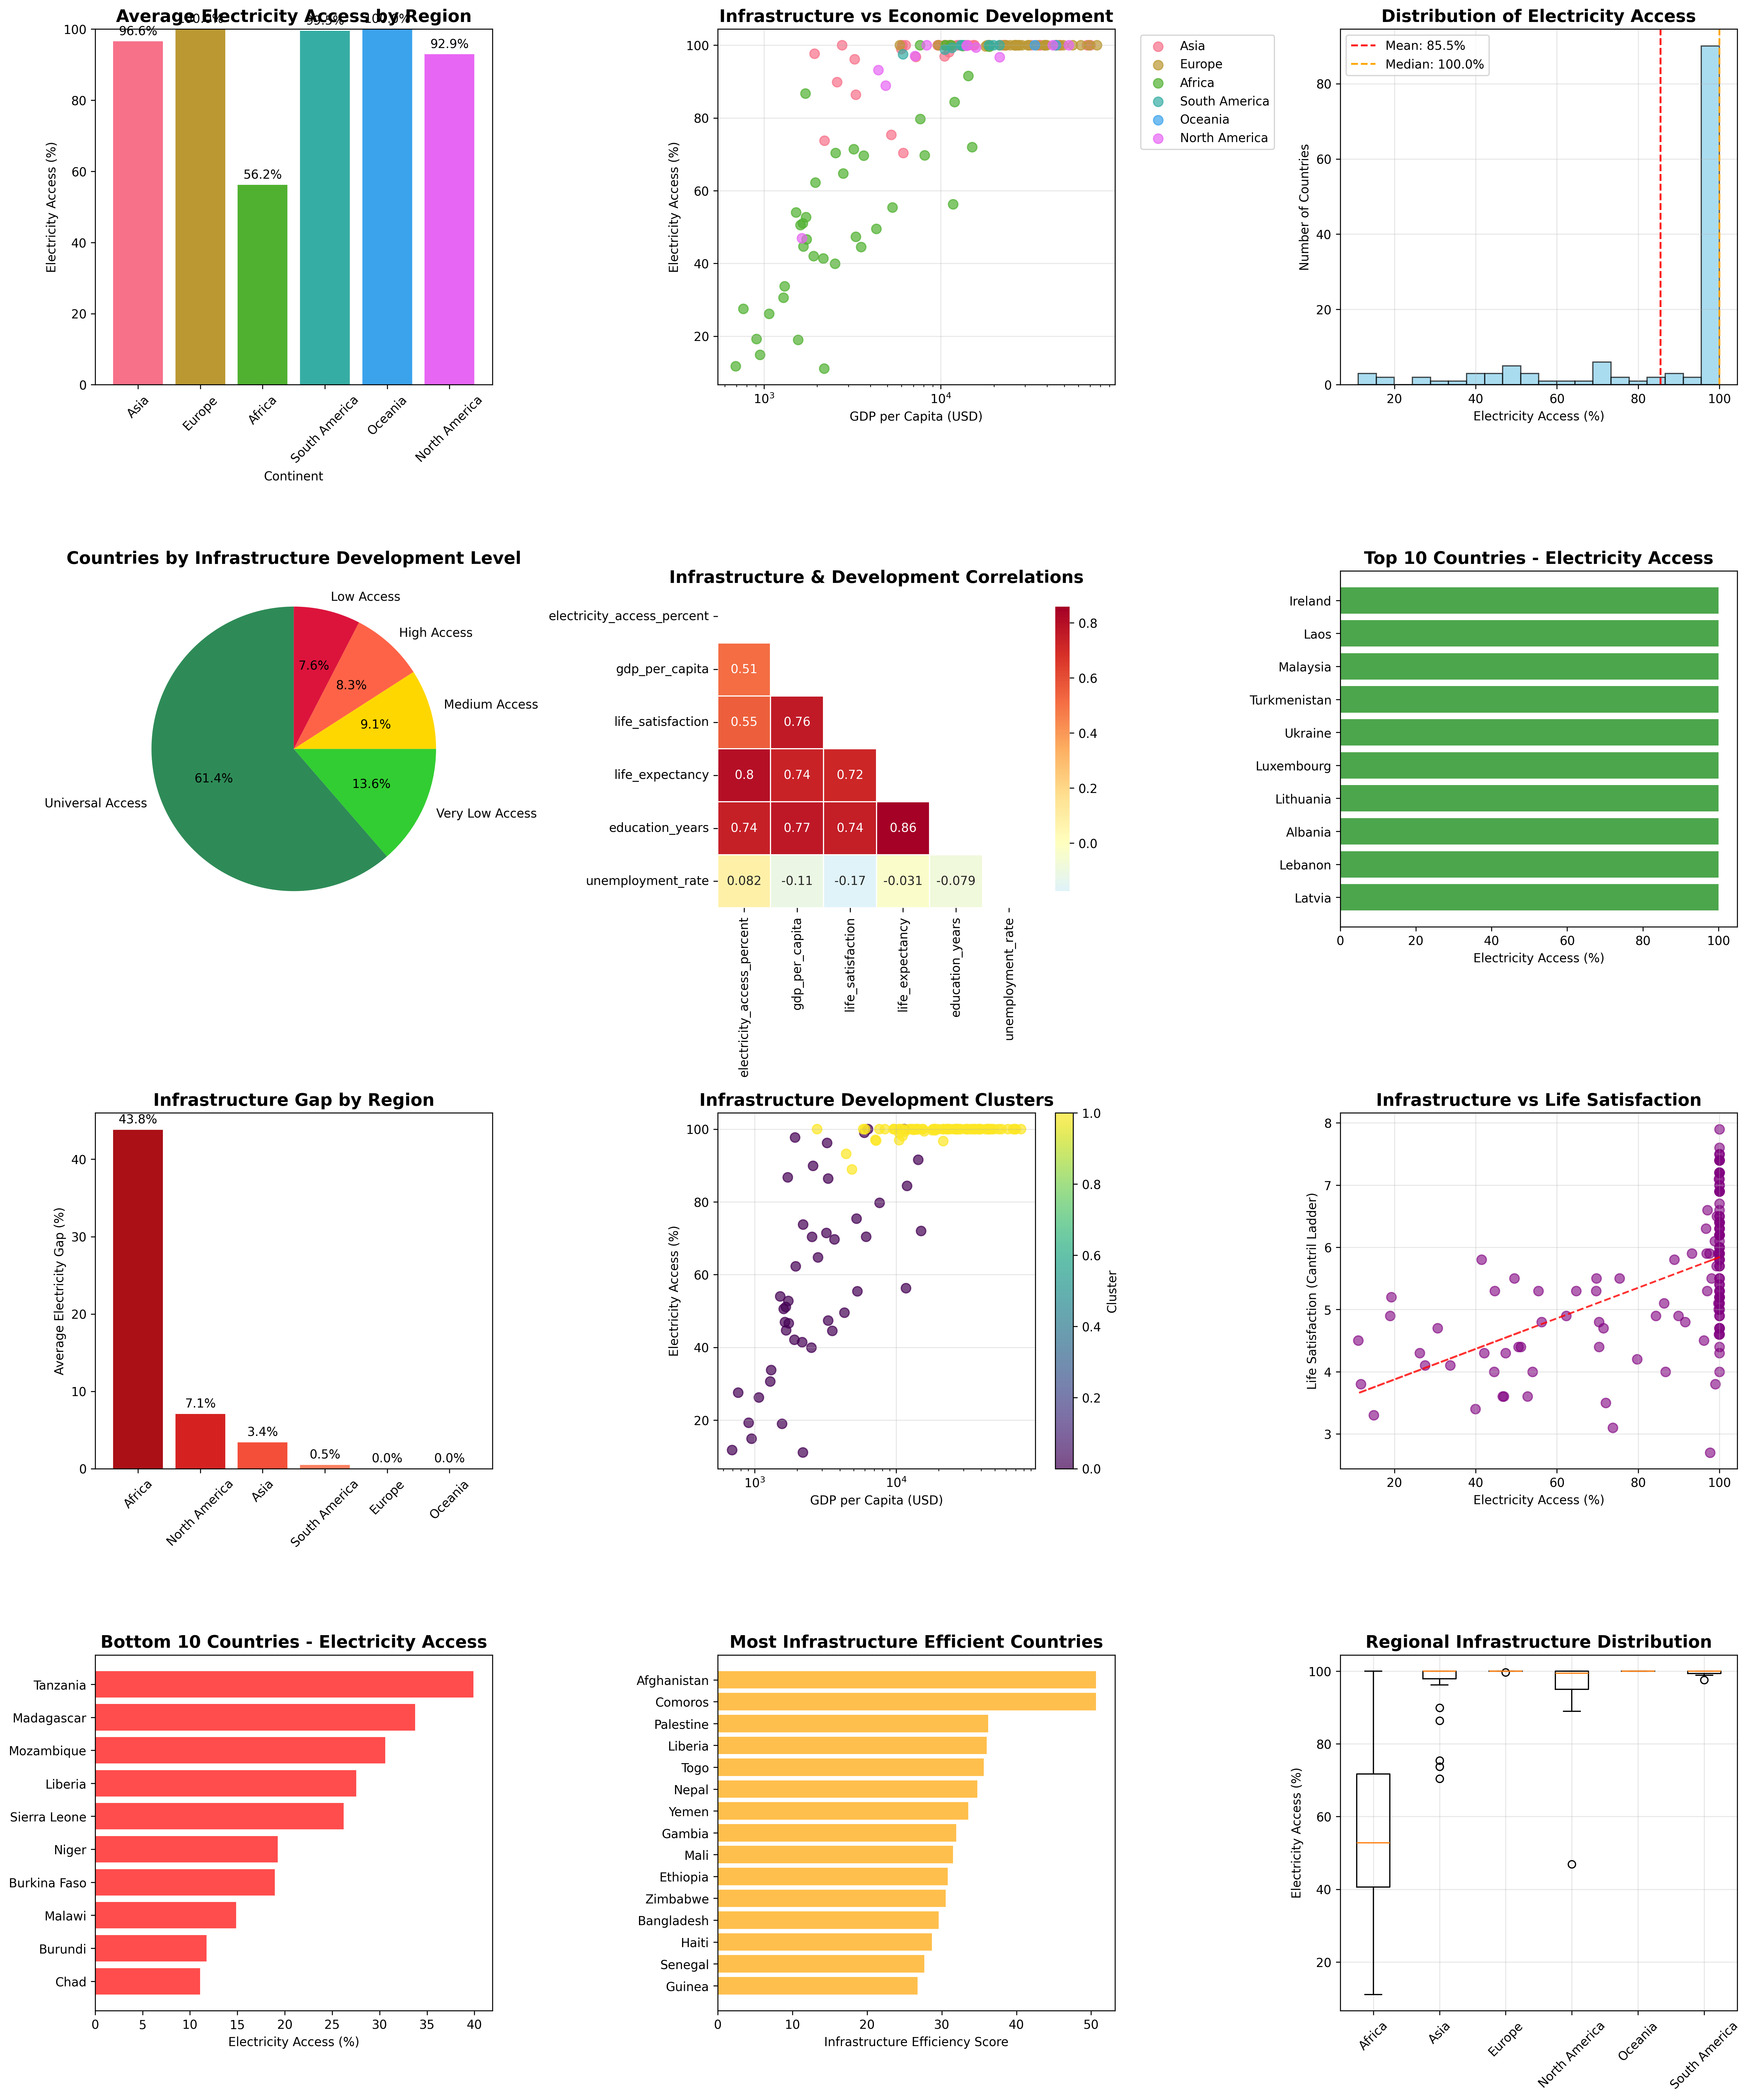
- Global Status: 85.5% average electricity access across 132 countries
- Universal Access: 81 countries achieve near-universal electricity access (≥99%)
- Regional Leaders: Oceania leads with 100.0% average access
- Development Gap: 43.8 percentage point gap between best and worst regions
🌍 Regional Analysis
| Region | Countries | Avg Access (%) | Median Access (%) | Universal Access | Avg GDP per Capita |
|---|---|---|---|---|---|
| Asia | 35 | 96.6% | 100.0% | 25 | $16,592 |
| Europe | 36 | 100.0% | 100.0% | 36 | $32,078 |
| Africa | 39 | 56.2% | 52.8% | 5 | $4,878 |
| South America | 9 | 99.5% | 100.0% | 7 | $14,204 |
| Oceania | 2 | 100.0% | 100.0% | 2 | $39,412 |
| North America | 11 | 92.9% | 99.4% | 6 | $17,074 |
📈 Statistical Analysis
ANOVA Test Results:
- F-statistic: 38.636
- P-value: 0.000000
- Result: Significant regional differences in electricity access (α = 0.05)
🔗 Infrastructure Correlations
| Variable | Correlation with Electricity Access | Strength | P-value | Significance |
|---|---|---|---|---|
| ↗️ Life Expectancy | 0.800 | Strong | 0.000 | ✅ Significant |
| ↗️ Education Years | 0.739 | Strong | 0.000 | ✅ Significant |
| ↗️ Life Satisfaction | 0.553 | Moderate | 0.000 | ✅ Significant |
| ↗️ Gdp Per Capita | 0.513 | Moderate | 0.000 | ✅ Significant |
| ↗️ Unemployment Rate | 0.082 | Weak | 0.450 | ❌ Not Significant |
🔍 Correlation Insights
- Strong Relationships: Found 2 strong correlations with electricity access
- Strongest Correlation: Life Expectancy is positively correlated (r = 0.800)
- Life Expectancy: As electricity access improves, life expectancy typically increases
- Education Years: As electricity access improves, education years typically increases
🎯 Infrastructure Development Clusters
Clustering Overview
Number of Clusters: 2
Clustering Quality (Silhouette Score): 0.485
Cluster 0 - 44 Countries
Average Electricity Access:
58.2%
Average GDP per Capita:
$3,870
Average Life Satisfaction:
4.42
Average Life Expectancy:
63.8 years
Average Education Years:
5.2 years
Countries in this cluster:
Afghanistan
Bangladesh
Benin
Botswana
Burkina Faso
Burundi
Cambodia
Cameroon
Chad
Comoros
Congo - Brazzaville
Cote d'Ivoire
Egypt
Eswatini
Ethiopia
Gabon
Gambia
Guinea
Haiti
India
Kenya
Laos
Liberia
Madagascar
Malawi
Mali
Mauritania
Mozambique
Myanmar
Namibia
Nepal
Niger
Nigeria
Pakistan
Rwanda
Senegal
Sierra Leone
South Africa
Tanzania
Togo
Uganda
Yemen
Zambia
Zimbabwe
Cluster 1 - 84 Countries
Average Electricity Access:
99.6%
Average GDP per Capita:
$25,002
Average Life Satisfaction:
6.05
Average Life Expectancy:
77.7 years
Average Education Years:
9.4 years
Countries in this cluster:
Albania
Algeria
Argentina
Armenia
Australia
Austria
Azerbaijan
Belarus
Belgium
Bosnia and Herzegovina
Brazil
Bulgaria
Canada
Chile
China
Colombia
Costa Rica
Croatia
Cyprus
Czechia
Denmark
Dominican Republic
Ecuador
El Salvador
Estonia
Finland
France
Georgia
Germany
Greece
Guatemala
Honduras
Indonesia
Iran
Ireland
Israel
Italy
Japan
Jordan
Kazakhstan
Kyrgyzstan
Latvia
Lebanon
Lithuania
Luxembourg
Malaysia
Malta
Mauritius
Mexico
Moldova
Mongolia
Montenegro
Morocco
Netherlands
New Zealand
Nicaragua
North Macedonia
Norway
Palestine
Panama
Peru
Philippines
Portugal
Romania
Russia
Saudi Arabia
Singapore
Slovakia
Slovenia
South Korea
Spain
Sri Lanka
Sweden
Switzerland
Thailand
Tunisia
Turkey
Ukraine
United Arab Emirates
United Kingdom
United States
Uruguay
Uzbekistan
Vietnam
🎯 Notable Infrastructure Patterns
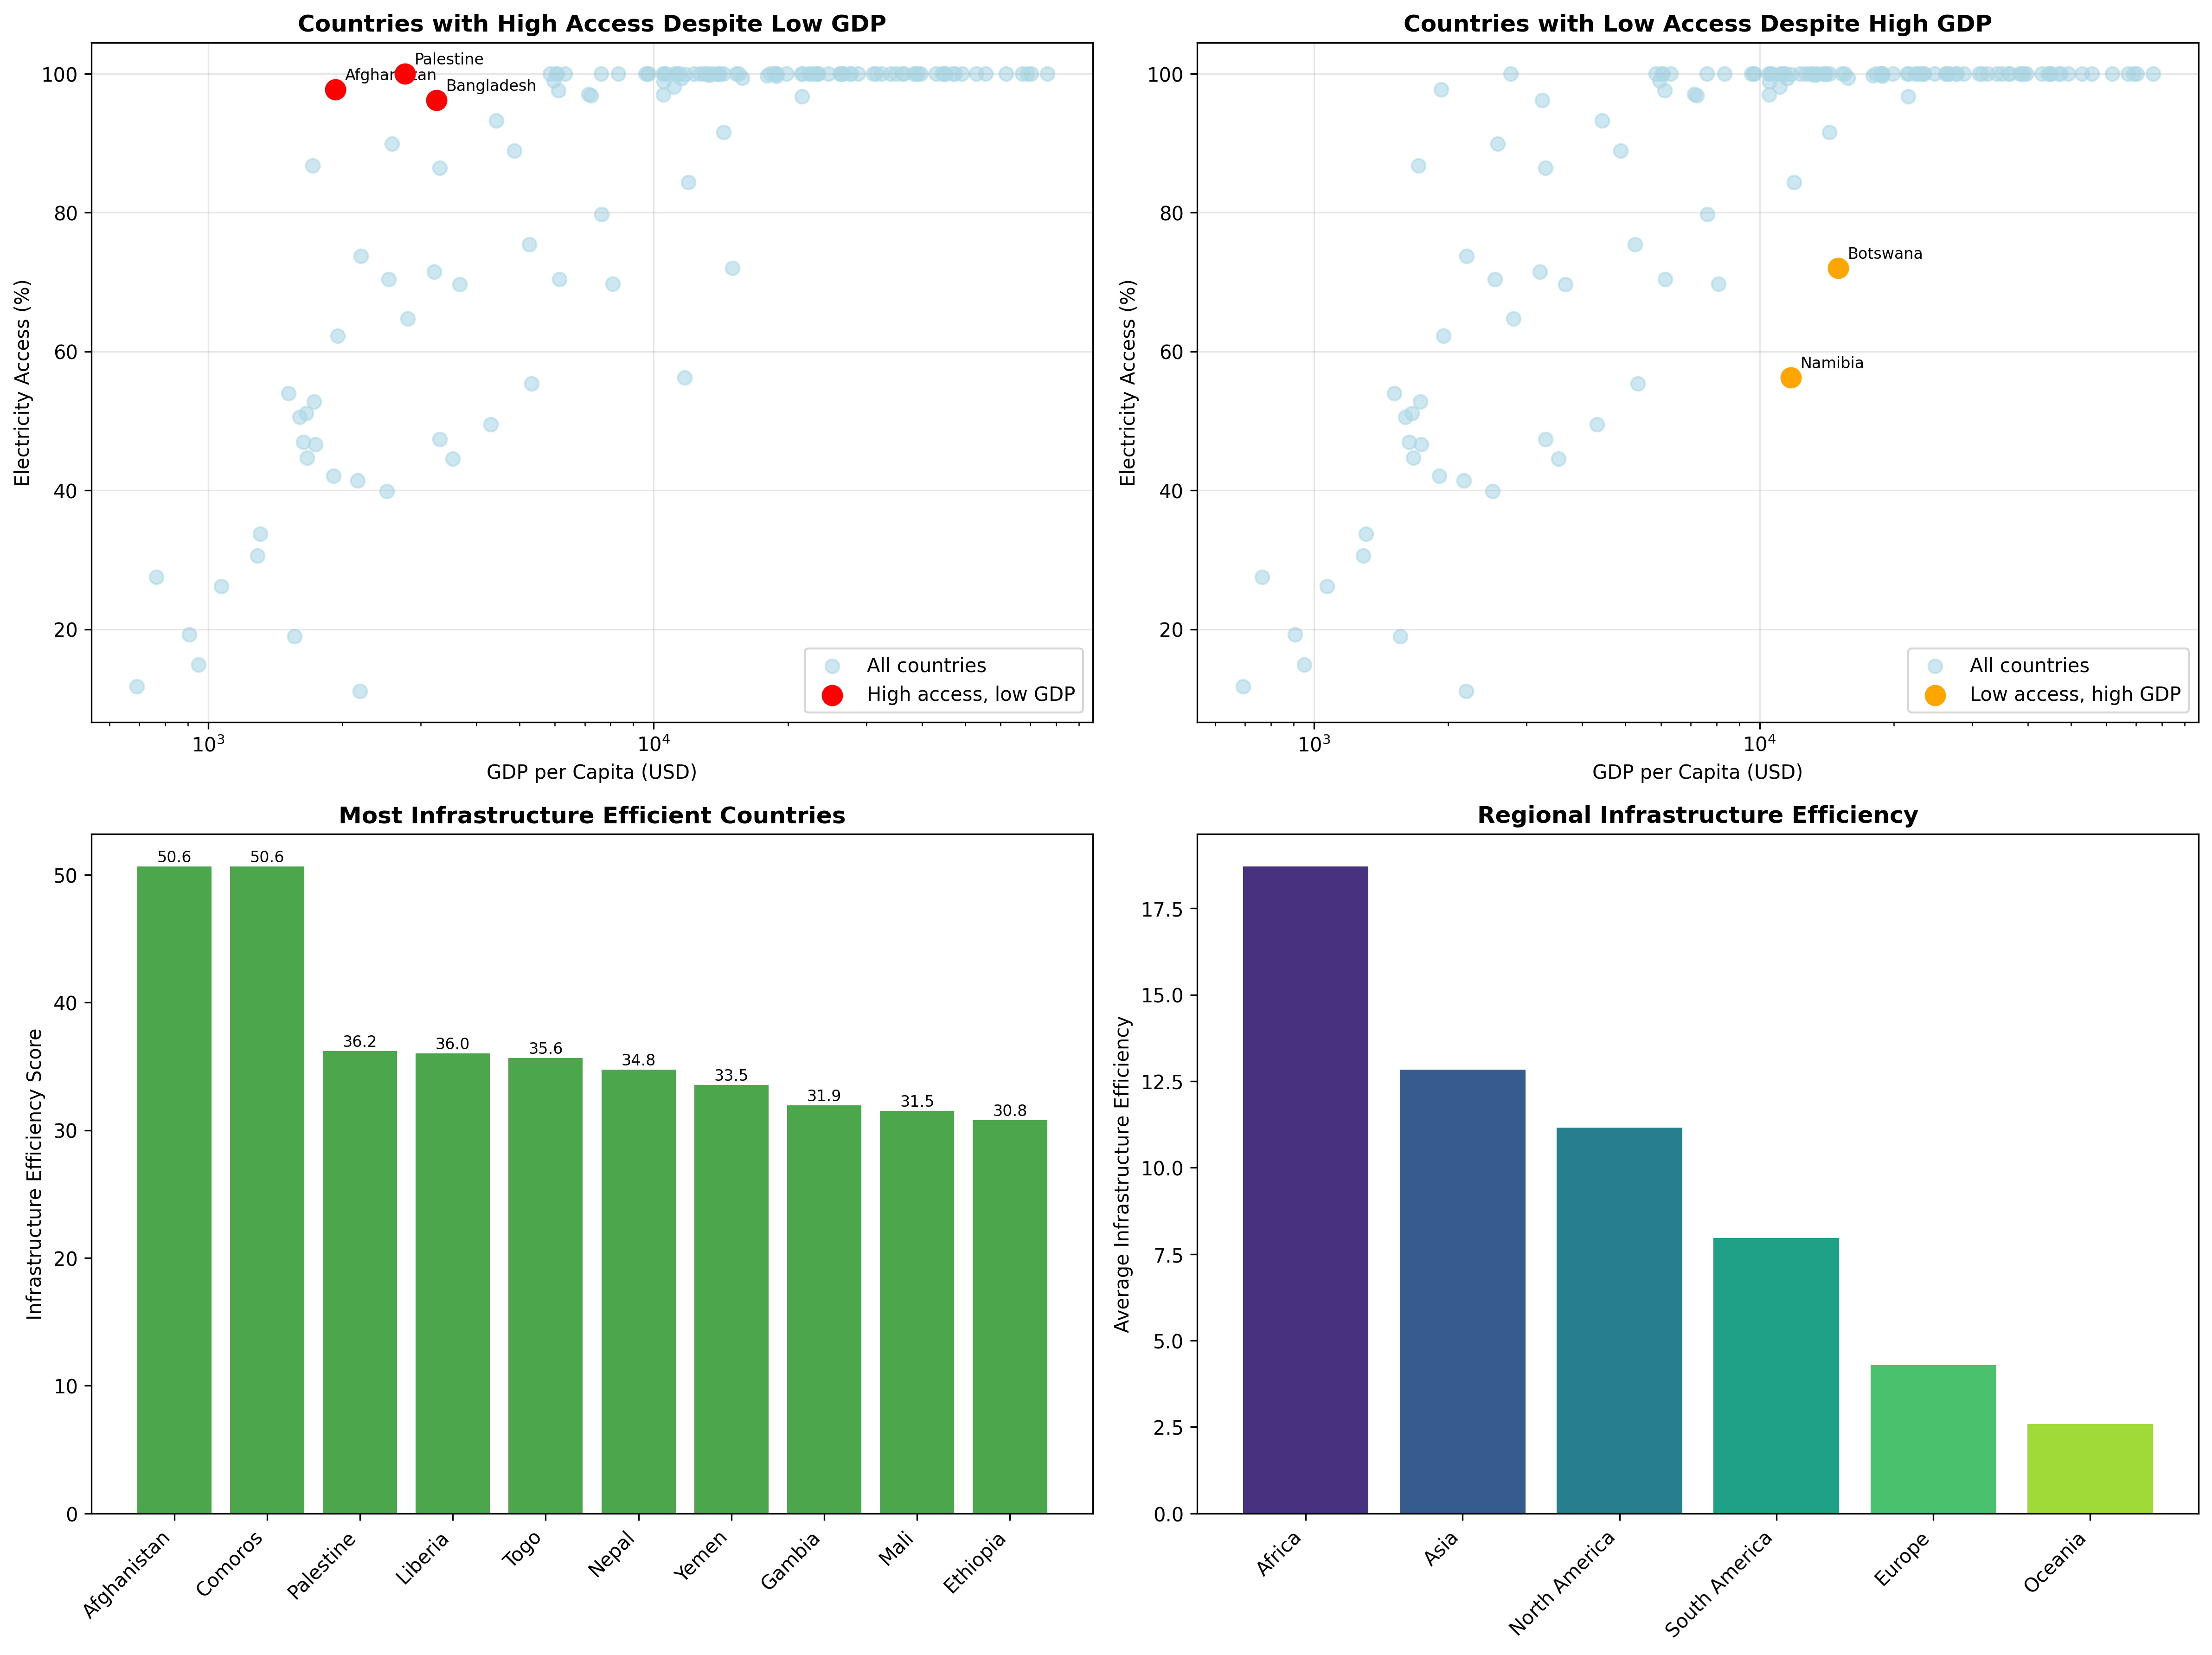
High Access, Low GDP
- Afghanistan: Achieves 97.7% electricity access with GDP of $1,929
- Bangladesh: Achieves 96.2% electricity access with GDP of $3,250
- Palestine: Achieves 100.0% electricity access with GDP of $2,762
Low Access, High GDP
- Botswana: Only 72.0% electricity access despite GDP of $15,015
- Namibia: Only 56.3% electricity access despite GDP of $11,741
High Infrastructure Efficiency
- Afghanistan: High infrastructure efficiency: 50.6
- Comoros: High infrastructure efficiency: 50.6
- Liberia: High infrastructure efficiency: 36.0
- Nepal: High infrastructure efficiency: 34.8
- Palestine: High infrastructure efficiency: 36.2
💡 Key Insights
- Global Infrastructure Status: Average electricity access stands at 85.5%, with 81 countries achieving near-universal access
- Top Performers: Albania, Argentina, Armenia lead in electricity access
- Improvement Opportunities: Chad, Burundi, Malawi have the lowest electricity access rates
- Key Relationship: Electricity access shows strongest correlation with life expectancy (r = 0.800)
- Development Patterns: Countries group into 2 distinct infrastructure development clusters
- Efficiency Examples: 3 countries achieve high electricity access despite lower GDP levels
🔬 Methodology
Data Sources & Indicators
- Primary Infrastructure Indicator: Percentage of population with access to electricity (2020)
- Supporting Indicators: Number of people with electricity access, GDP per capita, life satisfaction, life expectancy, education years
- Geographic Coverage: Global analysis across major continents
Analytical Methods
- Regional Analysis: ANOVA testing for significant regional differences
- Correlation Analysis: Pearson correlation coefficients with significance testing
- Clustering Analysis: K-means clustering with silhouette score optimization
- Outlier Detection: Statistical and logical outlier identification
- Infrastructure Metrics: Custom efficiency and gap calculations
Infrastructure Categories
- Universal Access: ≥99% electricity access
- High Access: 90-98% electricity access
- Medium Access: 70-89% electricity access
- Low Access: 50-69% electricity access
- Very Low Access: <50% electricity access
Infrastructure Analysis Report
Generated on: {datetime.now().strftime('%Y-%m-%d %H:%M:%S')}
Global Thriving Study - Infrastructure Dimension